29
/
en
AIzaSyAYiBZKx7MnpbEhh9jyipgxe19OcubqV5w
April 1, 2024
284609
Yemen, Rep.
YEM
true
2
1
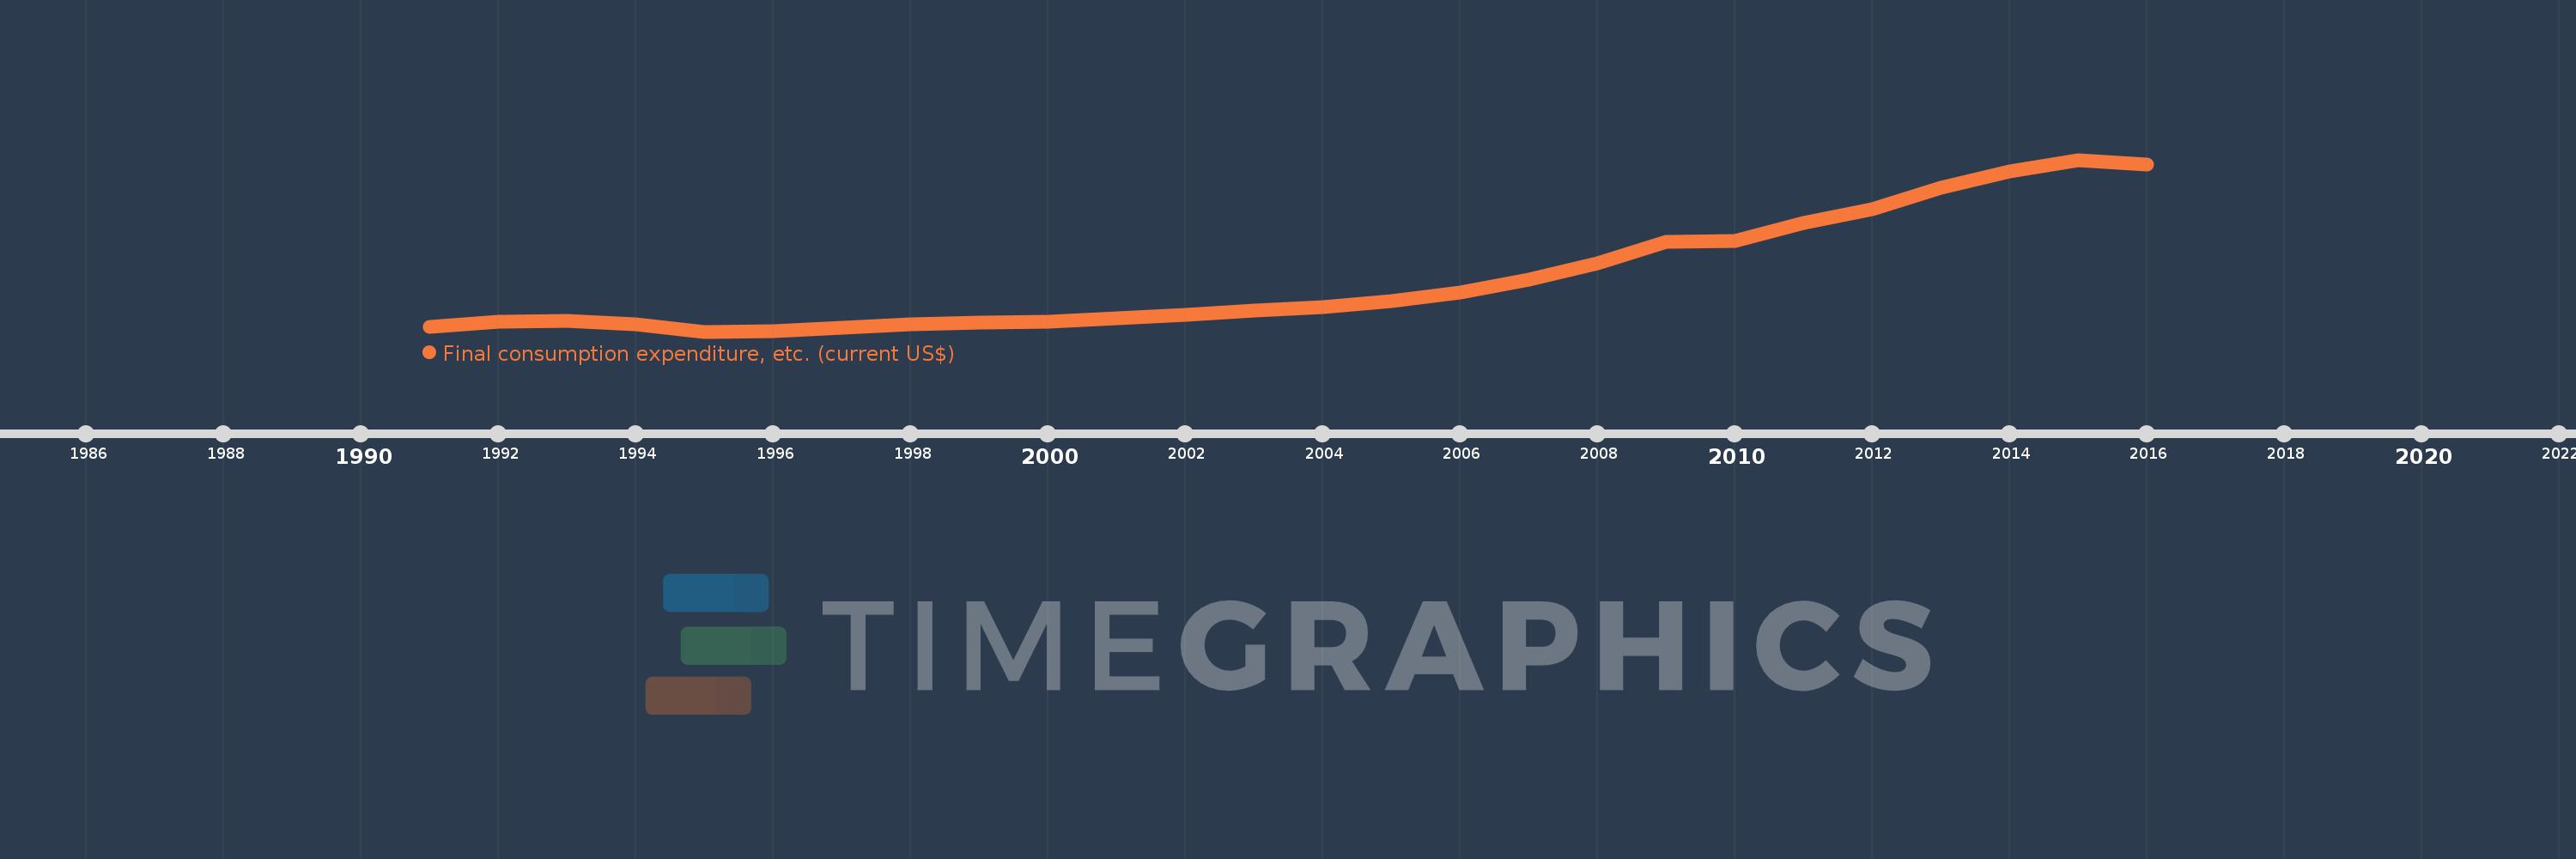
Final consumption expenditure, etc. (current US$)
2016,2015,2014,2013,2012,2011,2010,2009,2008,2007,2006,2005,2004,2003,2002,2001,2000,1999,1998,1997,1996,1995,1994,1993,1992,1991
This statistics in other country:
AfghanistanAlbaniaAlgeriaAngolaAntigua and BarbudaArab WorldArgentinaArmeniaArubaAustraliaAustriaAzerbaijanBahamas, TheBahrainBangladeshBarbadosBelarusBelgiumBelizeBeninBermudaBhutanBoliviaBosnia and HerzegovinaBotswanaBrazilBrunei DarussalamBulgariaBurkina FasoBurundiCabo VerdeCambodiaCameroonCanadaCaribbean small statesCentral African RepublicCentral Europe and the BalticsChadChileChinaColombiaComorosCongo, Dem. Rep.Congo, Rep.Costa RicaCote d'IvoireCroatiaCubaCyprusCzech RepublicDenmarkDjiboutiDominicaDominican RepublicEarly-demographic dividendEast Asia & PacificEast Asia & Pacific (excluding high income)East Asia & Pacific (IDA & IBRD countries)EcuadorEgypt, Arab Rep.El SalvadorEquatorial GuineaEritreaEstoniaEthiopiaEuro areaEurope & Central AsiaEurope & Central Asia (excluding high income)Europe & Central Asia (IDA & IBRD countries)European UnionFaroe IslandsFijiFinlandFragile and conflict affected situationsFranceGabonGambia, TheGeorgiaGermanyGhanaGreeceGrenadaGuatemalaGuineaGuinea-BissauGuyanaHaitiHeavily indebted poor countries (HIPC)High incomeHondurasHong Kong SAR, ChinaHungaryIBRD onlyIcelandIDA & IBRD totalIDA blendIDA onlyIDA totalIndiaIndonesiaIran, Islamic Rep.IraqIrelandIsraelItalyJamaicaJapanJordanKazakhstanKenyaKiribatiKorea, Rep.KosovoKuwaitKyrgyz RepublicLao PDRLate-demographic dividendLatin America & Caribbean Latin America & Caribbean (excluding high income)Latin America & the Caribbean (IDA & IBRD countries)LatviaLeast developed countries: UN classificationLebanonLesothoLiberiaLibyaLithuaniaLow & middle incomeLow incomeLower middle incomeLuxembourgMacao SAR, ChinaMacedonia, FYRMadagascarMalawiMalaysiaMaldivesMaliMaltaMauritaniaMauritiusMexicoMicronesia, Fed. Sts.Middle East & North AfricaMiddle East & North Africa (excluding high income)Middle East & North Africa (IDA & IBRD countries)Middle incomeMoldovaMongoliaMontenegroMoroccoMozambiqueNamibiaNepalNetherlandsNew CaledoniaNew ZealandNicaraguaNigerNigeriaNorth AmericaNorwayOECD membersOmanOther small statesPakistanPanamaPapua New GuineaParaguayPeruPhilippinesPolandPortugalPost-demographic dividendPre-demographic dividendPuerto RicoQatarRomaniaRussian FederationRwandaSaudi ArabiaSenegalSerbiaSeychellesSierra LeoneSingaporeSlovak RepublicSloveniaSmall statesSolomon IslandsSouth AfricaSouth AsiaSouth Asia (IDA & IBRD)South SudanSpainSri LankaSt. Kitts and NevisSt. LuciaSt. Vincent and the GrenadinesSub-Saharan Africa Sub-Saharan Africa (excluding high income)Sub-Saharan Africa (IDA & IBRD countries)SudanSurinameSwazilandSwedenSwitzerlandSyrian Arab RepublicTajikistanTanzaniaThailandTimor-LesteTogoTongaTrinidad and TobagoTunisiaTurkeyTurkmenistanUgandaUkraineUnited Arab EmiratesUnited KingdomUnited StatesUpper middle incomeUruguayUzbekistanVanuatuVenezuela, RBVietnamWest Bank and GazaWorldYemen, Rep.ZambiaZimbabwe Timeline:
This timeline shows a graph from 1991 to 2016 of Yemen, Rep.. No data until 1990. Number of actual observations by date: 26.
Source name:
World Development Indicators
Source organization:
World Bank national accounts data, and OECD National Accounts data files.
Categories, topics:
Economy & Growth
Last updated:
apr 23, 2017
Indicators value changes by year
Minimum:
4.065 bln
jan 1, 1995
Maximum:
42.812 bln
jan 1, 2015
At the date of observation
Value
Absolute change
Change from previous value
jan 1, 1991
5.225 bln
+5.225 bln
0.0%
jan 1, 1992
6.251 bln
+1.026 bln
19.65%
jan 1, 1993
6.435 bln
+183.651 mln
2.94%
jan 1, 1994
5.752 bln
-682.407 mln
-10.61%
jan 1, 1995
4.065 bln
-1.687 bln
-29.33%
jan 1, 1996
4.167 bln
+101.559 mln
2.5%
jan 1, 1997
4.969 bln
+802.568 mln
19.26%
jan 1, 1998
5.757 bln
+788.096 mln
15.86%
jan 1, 1999
6.133 bln
+376.217 mln
6.53%
jan 1, 2000
6.389 bln
+255.94 mln
4.17%
jan 1, 2001
7.101 bln
+711.934 mln
11.14%
jan 1, 2002
7.838 bln
+736.377 mln
10.37%
jan 1, 2003
8.795 bln
+956.887 mln
12.21%
jan 1, 2004
9.514 bln
+719.233 mln
8.18%
jan 1, 2005
10.933 bln
+1.419 bln
14.91%
jan 1, 2006
12.808 bln
+1.876 bln
17.16%
jan 1, 2007
15.871 bln
+3.063 bln
23.91%
jan 1, 2008
19.517 bln
+3.646 bln
22.97%
jan 1, 2009
24.261 bln
+4.744 bln
24.31%
jan 1, 2010
24.597 bln
+335.118 mln
1.38%
jan 1, 2011
28.661 bln
+4.065 bln
16.53%
jan 1, 2012
31.705 bln
+3.044 bln
10.62%
jan 1, 2013
36.439 bln
+4.734 bln
14.93%
jan 1, 2014
40.289 bln
+3.85 bln
10.57%
jan 1, 2015
42.812 bln
+2.523 bln
6.26%
jan 1, 2016
41.702 bln
-1.11 bln
-2.59%
Ranking of countries by current statistics by years


Comments: