29
/
en
AIzaSyAYiBZKx7MnpbEhh9jyipgxe19OcubqV5w
April 1, 2024
47097
Lower middle income
LMC
false
2
1
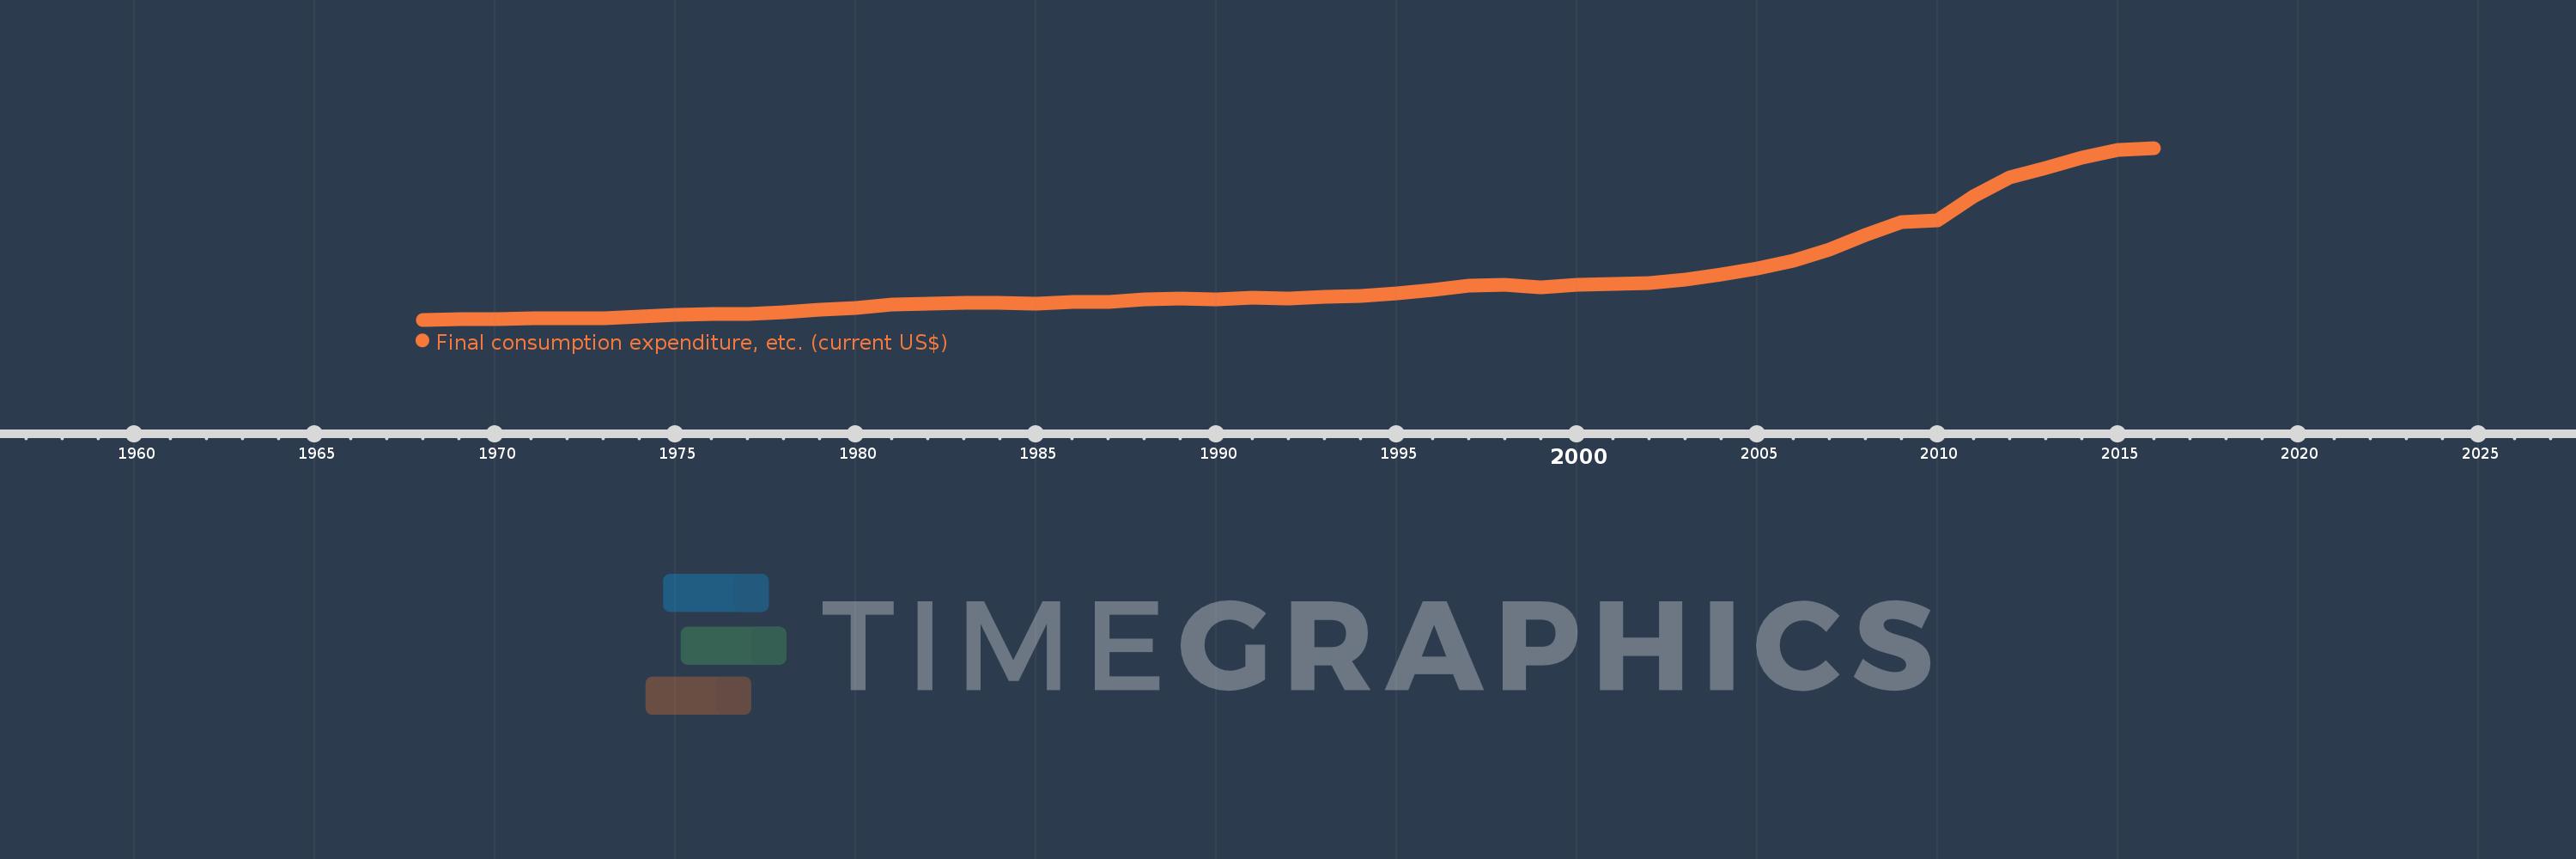
Final consumption expenditure, etc. (current US$)
2016,2015,2014,2013,2012,2011,2010,2009,2008,2007,2006,2005,2004,2003,2002,2001,2000,1999,1998,1997,1996,1995,1994,1993,1992,1991,1990,1989,1988,1987,1986,1985,1984,1983,1982,1981,1980,1979,1978,1977,1976,1975,1974,1973,1972,1971,1970,1969,1968
This statistics in other country:
AfghanistanAlbaniaAlgeriaAngolaAntigua and BarbudaArab WorldArgentinaArmeniaArubaAustraliaAustriaAzerbaijanBahamas, TheBahrainBangladeshBarbadosBelarusBelgiumBelizeBeninBermudaBhutanBoliviaBosnia and HerzegovinaBotswanaBrazilBrunei DarussalamBulgariaBurkina FasoBurundiCabo VerdeCambodiaCameroonCanadaCaribbean small statesCentral African RepublicCentral Europe and the BalticsChadChileChinaColombiaComorosCongo, Dem. Rep.Congo, Rep.Costa RicaCote d'IvoireCroatiaCubaCyprusCzech RepublicDenmarkDjiboutiDominicaDominican RepublicEarly-demographic dividendEast Asia & PacificEast Asia & Pacific (excluding high income)East Asia & Pacific (IDA & IBRD countries)EcuadorEgypt, Arab Rep.El SalvadorEquatorial GuineaEritreaEstoniaEthiopiaEuro areaEurope & Central AsiaEurope & Central Asia (excluding high income)Europe & Central Asia (IDA & IBRD countries)European UnionFaroe IslandsFijiFinlandFragile and conflict affected situationsFranceGabonGambia, TheGeorgiaGermanyGhanaGreeceGrenadaGuatemalaGuineaGuinea-BissauGuyanaHaitiHeavily indebted poor countries (HIPC)High incomeHondurasHong Kong SAR, ChinaHungaryIBRD onlyIcelandIDA & IBRD totalIDA blendIDA onlyIDA totalIndiaIndonesiaIran, Islamic Rep.IraqIrelandIsraelItalyJamaicaJapanJordanKazakhstanKenyaKiribatiKorea, Rep.KosovoKuwaitKyrgyz RepublicLao PDRLate-demographic dividendLatin America & Caribbean Latin America & Caribbean (excluding high income)Latin America & the Caribbean (IDA & IBRD countries)LatviaLeast developed countries: UN classificationLebanonLesothoLiberiaLibyaLithuaniaLow & middle incomeLow incomeLower middle incomeLuxembourgMacao SAR, ChinaMacedonia, FYRMadagascarMalawiMalaysiaMaldivesMaliMaltaMauritaniaMauritiusMexicoMicronesia, Fed. Sts.Middle East & North AfricaMiddle East & North Africa (excluding high income)Middle East & North Africa (IDA & IBRD countries)Middle incomeMoldovaMongoliaMontenegroMoroccoMozambiqueNamibiaNepalNetherlandsNew CaledoniaNew ZealandNicaraguaNigerNigeriaNorth AmericaNorwayOECD membersOmanOther small statesPakistanPanamaPapua New GuineaParaguayPeruPhilippinesPolandPortugalPost-demographic dividendPre-demographic dividendPuerto RicoQatarRomaniaRussian FederationRwandaSaudi ArabiaSenegalSerbiaSeychellesSierra LeoneSingaporeSlovak RepublicSloveniaSmall statesSolomon IslandsSouth AfricaSouth AsiaSouth Asia (IDA & IBRD)South SudanSpainSri LankaSt. Kitts and NevisSt. LuciaSt. Vincent and the GrenadinesSub-Saharan Africa Sub-Saharan Africa (excluding high income)Sub-Saharan Africa (IDA & IBRD countries)SudanSurinameSwazilandSwedenSwitzerlandSyrian Arab RepublicTajikistanTanzaniaThailandTimor-LesteTogoTongaTrinidad and TobagoTunisiaTurkeyTurkmenistanUgandaUkraineUnited Arab EmiratesUnited KingdomUnited StatesUpper middle incomeUruguayUzbekistanVanuatuVenezuela, RBVietnamWest Bank and GazaWorldYemen, Rep.ZambiaZimbabwe Timeline:
This timeline shows a graph from 1968 to 2016 of Lower middle income. No data until 1967. Number of actual observations by date: 49.
Source name:
World Development Indicators
Source organization:
World Bank national accounts data, and OECD National Accounts data files.
Categories, topics:
Economy & Growth
Last updated:
apr 23, 2017
Indicators value changes by year
Minimum:
124.4 bln
jan 1, 1968
Maximum:
4.524 trl
jan 1, 2016
At the date of observation
Value
Absolute change
Change from previous value
jan 1, 1968
124.4 bln
+124.4 bln
0.0%
jan 1, 1969
132.662 bln
+8.262 bln
6.64%
jan 1, 1970
145.838 bln
+13.176 bln
9.93%
jan 1, 1971
153.589 bln
+7.751 bln
5.31%
jan 1, 1972
163.499 bln
+9.911 bln
6.45%
jan 1, 1973
170.077 bln
+6.577 bln
4.02%
jan 1, 1974
198.942 bln
+28.865 bln
16.97%
jan 1, 1975
244.845 bln
+45.903 bln
23.07%
jan 1, 1976
275.303 bln
+30.458 bln
12.44%
jan 1, 1977
282.705 bln
+7.402 bln
2.69%
jan 1, 1978
325.528 bln
+42.824 bln
15.15%
jan 1, 1979
370.933 bln
+45.405 bln
13.95%
jan 1, 1980
415.323 bln
+44.39 bln
11.97%
jan 1, 1981
512.274 bln
+96.951 bln
23.34%
jan 1, 1982
543.893 bln
+31.619 bln
6.17%
jan 1, 1983
551.997 bln
+8.104 bln
1.49%
jan 1, 1984
547.949 bln
-4.048 bln
-0.73%
jan 1, 1985
545.122 bln
-2.827 bln
-0.52%
jan 1, 1986
574.603 bln
+29.48 bln
5.41%
jan 1, 1987
587.567 bln
+12.964 bln
2.26%
jan 1, 1988
645.728 bln
+58.161 bln
9.9%
jan 1, 1989
657.131 bln
+11.403 bln
1.77%
jan 1, 1990
641.926 bln
-15.205 bln
-2.31%
jan 1, 1991
693.957 bln
+52.031 bln
8.11%
jan 1, 1992
666.84 bln
-27.117 bln
-3.91%
jan 1, 1993
708.491 bln
+41.651 bln
6.25%
jan 1, 1994
729.196 bln
+20.705 bln
2.92%
jan 1, 1995
789.906 bln
+60.71 bln
8.33%
jan 1, 1996
891.639 bln
+101.733 bln
12.88%
jan 1, 1997
1.002 trl
+110.278 bln
12.37%
jan 1, 1998
1.025 trl
+23.287 bln
2.32%
jan 1, 1999
951.929 bln
-73.274 bln
-7.15%
jan 1, 2000
1.018 trl
+66.299 bln
6.96%
jan 1, 2001
1.045 trl
+27.197 bln
2.67%
jan 1, 2002
1.063 trl
+17.615 bln
1.68%
jan 1, 2003
1.146 trl
+83.084 bln
7.82%
jan 1, 2004
1.287 trl
+140.847 bln
12.29%
jan 1, 2005
1.433 trl
+146.179 bln
11.36%
jan 1, 2006
1.642 trl
+209.233 bln
14.6%
jan 1, 2007
1.913 trl
+271.09 bln
16.51%
jan 1, 2008
2.288 trl
+374.71 bln
19.58%
jan 1, 2009
2.636 trl
+348.042 bln
15.21%
jan 1, 2010
2.669 trl
+33.075 bln
1.25%
jan 1, 2011
3.28 trl
+610.34 bln
22.87%
jan 1, 2012
3.77 trl
+490.175 bln
14.95%
jan 1, 2013
4.015 trl
+245.174 bln
6.5%
jan 1, 2014
4.271 trl
+255.744 bln
6.37%
jan 1, 2015
4.48 trl
+208.823 bln
4.89%
jan 1, 2016
4.524 trl
+44.235 bln
0.99%
Ranking of countries by current statistics by years


Comments: