29
/
en
AIzaSyAYiBZKx7MnpbEhh9jyipgxe19OcubqV5w
April 1, 2024
34932
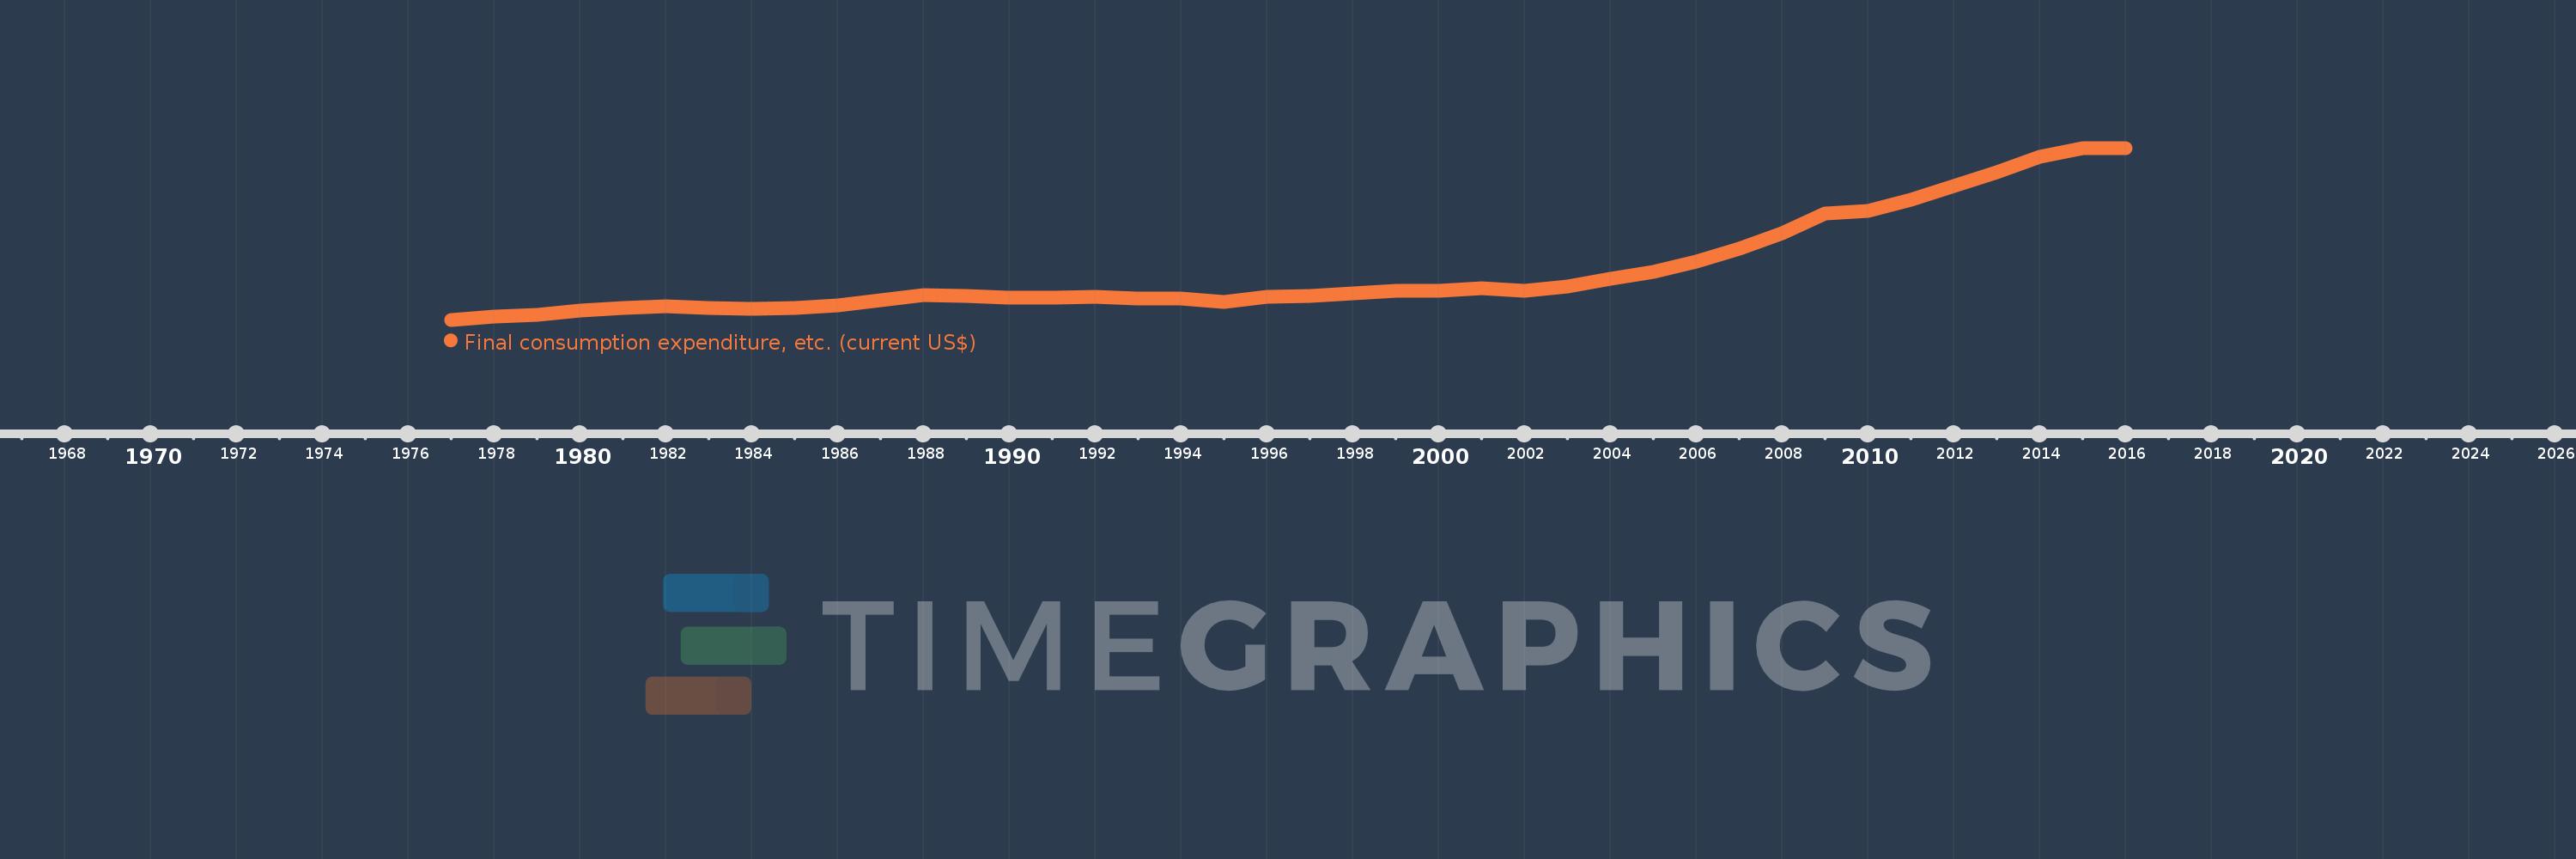
Heavily indebted poor countries (HIPC)
HPC
false
2
1
Final consumption expenditure, etc. (current US$)
2016,2015,2014,2013,2012,2011,2010,2009,2008,2007,2006,2005,2004,2003,2002,2001,2000,1999,1998,1997,1996,1995,1994,1993,1992,1991,1990,1989,1988,1987,1986,1985,1984,1983,1982,1981,1980,1979,1978,1977
This statistics in other country:
AfghanistanAlbaniaAlgeriaAngolaAntigua and BarbudaArab WorldArgentinaArmeniaArubaAustraliaAustriaAzerbaijanBahamas, TheBahrainBangladeshBarbadosBelarusBelgiumBelizeBeninBermudaBhutanBoliviaBosnia and HerzegovinaBotswanaBrazilBrunei DarussalamBulgariaBurkina FasoBurundiCabo VerdeCambodiaCameroonCanadaCaribbean small statesCentral African RepublicCentral Europe and the BalticsChadChileChinaColombiaComorosCongo, Dem. Rep.Congo, Rep.Costa RicaCote d'IvoireCroatiaCubaCyprusCzech RepublicDenmarkDjiboutiDominicaDominican RepublicEarly-demographic dividendEast Asia & PacificEast Asia & Pacific (excluding high income)East Asia & Pacific (IDA & IBRD countries)EcuadorEgypt, Arab Rep.El SalvadorEquatorial GuineaEritreaEstoniaEthiopiaEuro areaEurope & Central AsiaEurope & Central Asia (excluding high income)Europe & Central Asia (IDA & IBRD countries)European UnionFaroe IslandsFijiFinlandFragile and conflict affected situationsFranceGabonGambia, TheGeorgiaGermanyGhanaGreeceGrenadaGuatemalaGuineaGuinea-BissauGuyanaHaitiHeavily indebted poor countries (HIPC)High incomeHondurasHong Kong SAR, ChinaHungaryIBRD onlyIcelandIDA & IBRD totalIDA blendIDA onlyIDA totalIndiaIndonesiaIran, Islamic Rep.IraqIrelandIsraelItalyJamaicaJapanJordanKazakhstanKenyaKiribatiKorea, Rep.KosovoKuwaitKyrgyz RepublicLao PDRLate-demographic dividendLatin America & Caribbean Latin America & Caribbean (excluding high income)Latin America & the Caribbean (IDA & IBRD countries)LatviaLeast developed countries: UN classificationLebanonLesothoLiberiaLibyaLithuaniaLow & middle incomeLow incomeLower middle incomeLuxembourgMacao SAR, ChinaMacedonia, FYRMadagascarMalawiMalaysiaMaldivesMaliMaltaMauritaniaMauritiusMexicoMicronesia, Fed. Sts.Middle East & North AfricaMiddle East & North Africa (excluding high income)Middle East & North Africa (IDA & IBRD countries)Middle incomeMoldovaMongoliaMontenegroMoroccoMozambiqueNamibiaNepalNetherlandsNew CaledoniaNew ZealandNicaraguaNigerNigeriaNorth AmericaNorwayOECD membersOmanOther small statesPakistanPanamaPapua New GuineaParaguayPeruPhilippinesPolandPortugalPost-demographic dividendPre-demographic dividendPuerto RicoQatarRomaniaRussian FederationRwandaSaudi ArabiaSenegalSerbiaSeychellesSierra LeoneSingaporeSlovak RepublicSloveniaSmall statesSolomon IslandsSouth AfricaSouth AsiaSouth Asia (IDA & IBRD)South SudanSpainSri LankaSt. Kitts and NevisSt. LuciaSt. Vincent and the GrenadinesSub-Saharan Africa Sub-Saharan Africa (excluding high income)Sub-Saharan Africa (IDA & IBRD countries)SudanSurinameSwazilandSwedenSwitzerlandSyrian Arab RepublicTajikistanTanzaniaThailandTimor-LesteTogoTongaTrinidad and TobagoTunisiaTurkeyTurkmenistanUgandaUkraineUnited Arab EmiratesUnited KingdomUnited StatesUpper middle incomeUruguayUzbekistanVanuatuVenezuela, RBVietnamWest Bank and GazaWorldYemen, Rep.ZambiaZimbabwe Timeline:
This timeline shows a graph from 1977 to 2016 of Heavily indebted poor countries (HIPC). No data until 1976. Number of actual observations by date: 40.
Source name:
World Development Indicators
Source organization:
World Bank national accounts data, and OECD National Accounts data files.
Categories, topics:
Economy & Growth
Last updated:
apr 23, 2017
Indicators value changes by year
Minimum:
52.015 bln
jan 1, 1977
Maximum:
547.939 bln
jan 1, 2015
At the date of observation
Value
Absolute change
Change from previous value
jan 1, 1977
52.015 bln
+52.015 bln
0.0%
jan 1, 1978
60.289 bln
+8.273 bln
15.91%
jan 1, 1979
67.35 bln
+7.061 bln
11.71%
jan 1, 1980
79.447 bln
+12.098 bln
17.96%
jan 1, 1981
87.112 bln
+7.665 bln
9.65%
jan 1, 1982
90.332 bln
+3.22 bln
3.7%
jan 1, 1983
86.959 bln
-3.373 bln
-3.73%
jan 1, 1984
82.909 bln
-4.05 bln
-4.66%
jan 1, 1985
87.11 bln
+4.202 bln
5.07%
jan 1, 1986
92.743 bln
+5.633 bln
6.47%
jan 1, 1987
109.042 bln
+16.298 bln
17.57%
jan 1, 1988
122.415 bln
+13.373 bln
12.26%
jan 1, 1989
121.032 bln
-1.382 bln
-1.13%
jan 1, 1990
114.667 bln
-6.366 bln
-5.26%
jan 1, 1991
115.313 bln
+646.497 mln
0.56%
jan 1, 1992
118.921 bln
+3.608 bln
3.13%
jan 1, 1993
112.037 bln
-6.884 bln
-5.79%
jan 1, 1994
113.257 bln
+1.22 bln
1.09%
jan 1, 1995
102.536 bln
-10.721 bln
-9.47%
jan 1, 1996
117.388 bln
+14.852 bln
14.48%
jan 1, 1997
121.53 bln
+4.142 bln
3.53%
jan 1, 1998
128.781 bln
+7.251 bln
5.97%
jan 1, 1999
135.385 bln
+6.604 bln
5.13%
jan 1, 2000
135.327 bln
-57.64 mln
-0.04%
jan 1, 2001
143.591 bln
+8.263 bln
6.11%
jan 1, 2002
135.769 bln
-7.821 bln
-5.45%
jan 1, 2003
148.394 bln
+12.625 bln
9.3%
jan 1, 2004
169.07 bln
+20.676 bln
13.93%
jan 1, 2005
190.556 bln
+21.485 bln
12.71%
jan 1, 2006
219.79 bln
+29.234 bln
15.34%
jan 1, 2007
256.446 bln
+36.656 bln
16.68%
jan 1, 2008
302.551 bln
+46.105 bln
17.98%
jan 1, 2009
358.074 bln
+55.523 bln
18.35%
jan 1, 2010
366.186 bln
+8.112 bln
2.27%
jan 1, 2011
399.448 bln
+33.262 bln
9.08%
jan 1, 2012
438.879 bln
+39.431 bln
9.87%
jan 1, 2013
478.204 bln
+39.324 bln
8.96%
jan 1, 2014
523.157 bln
+44.953 bln
9.4%
jan 1, 2015
547.939 bln
+24.782 bln
4.74%
jan 1, 2016
547.298 bln
-641.132 mln
-0.12%
Ranking of countries by current statistics by years


Comments: