29
/
en
AIzaSyAYiBZKx7MnpbEhh9jyipgxe19OcubqV5w
April 1, 2024
44219
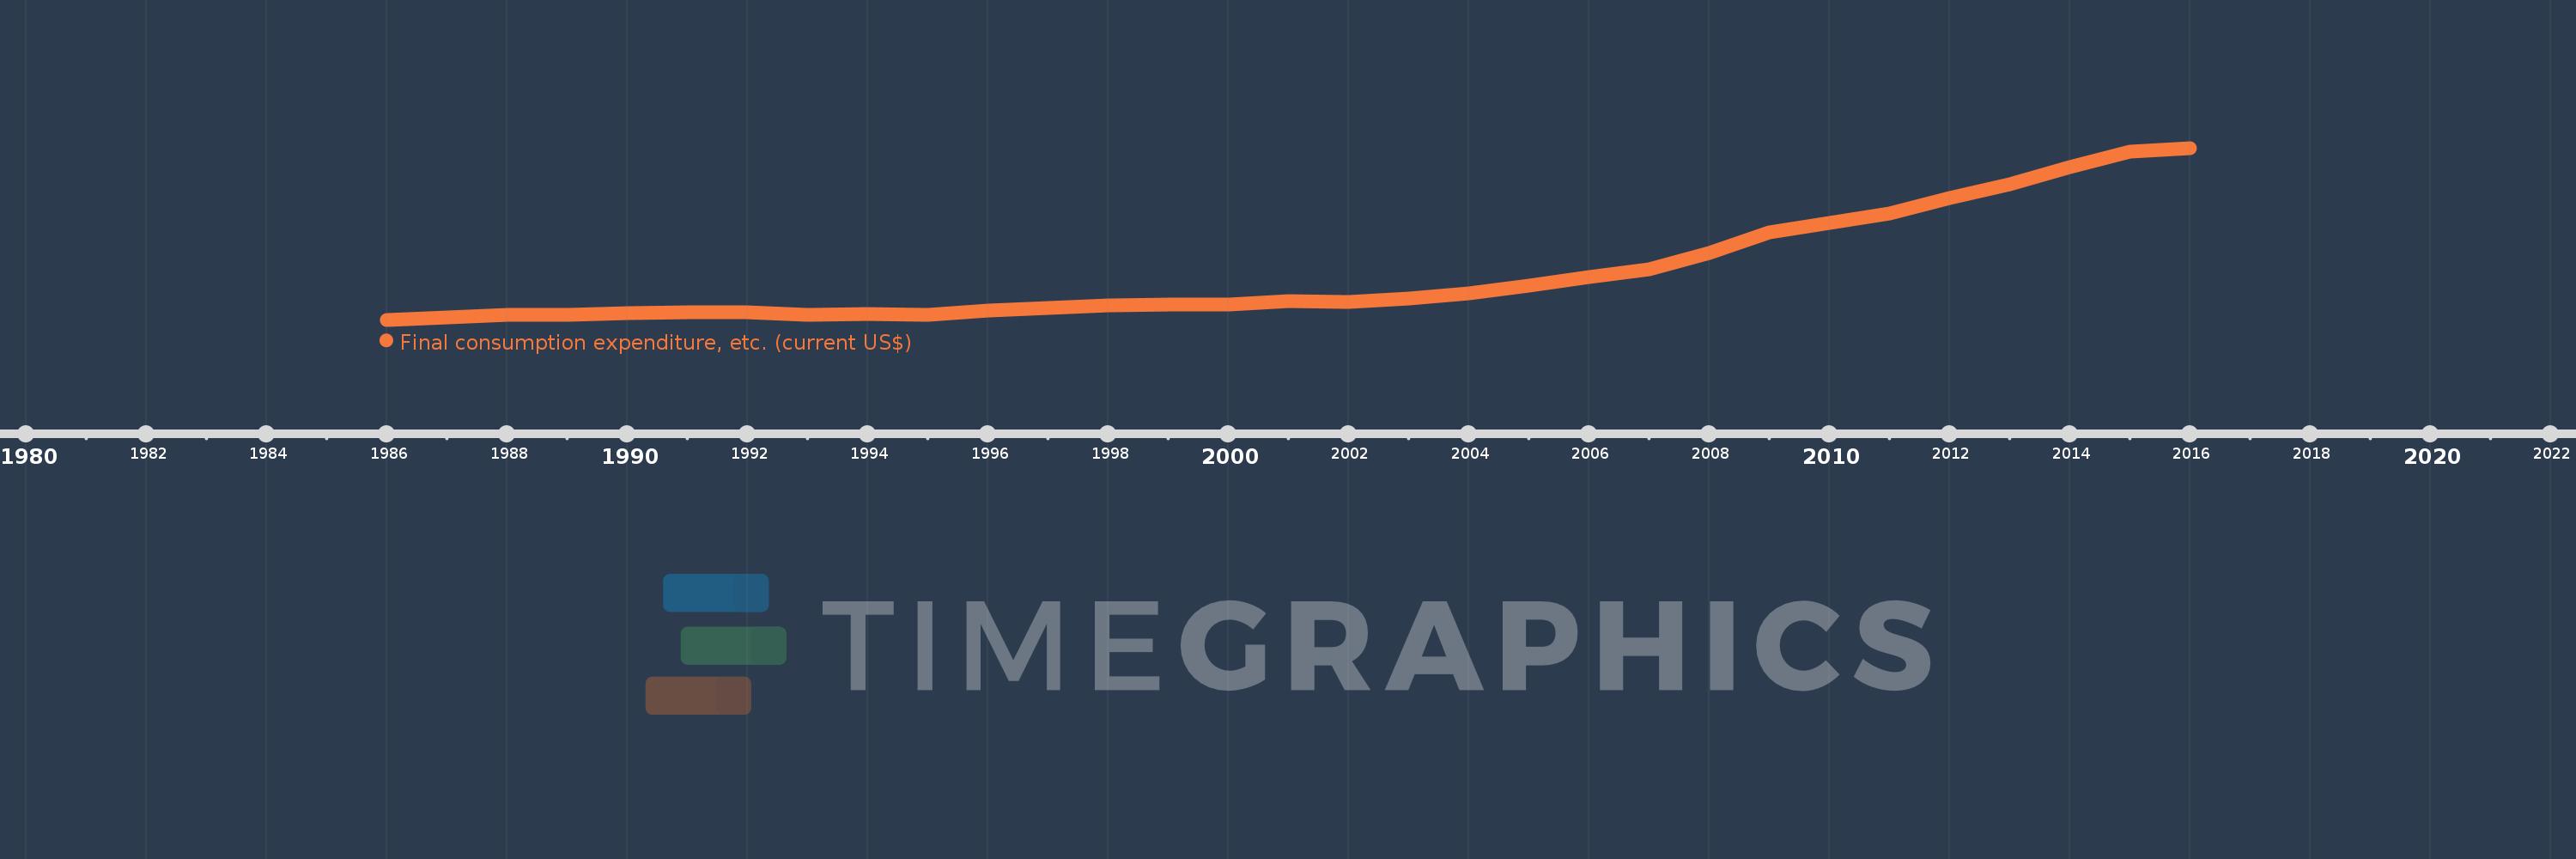
Least developed countries: UN classification
LDC
false
2
1
Final consumption expenditure, etc. (current US$)
2016,2015,2014,2013,2012,2011,2010,2009,2008,2007,2006,2005,2004,2003,2002,2001,2000,1999,1998,1997,1996,1995,1994,1993,1992,1991,1990,1989,1988,1987,1986
This statistics in other country:
AfghanistanAlbaniaAlgeriaAngolaAntigua and BarbudaArab WorldArgentinaArmeniaArubaAustraliaAustriaAzerbaijanBahamas, TheBahrainBangladeshBarbadosBelarusBelgiumBelizeBeninBermudaBhutanBoliviaBosnia and HerzegovinaBotswanaBrazilBrunei DarussalamBulgariaBurkina FasoBurundiCabo VerdeCambodiaCameroonCanadaCaribbean small statesCentral African RepublicCentral Europe and the BalticsChadChileChinaColombiaComorosCongo, Dem. Rep.Congo, Rep.Costa RicaCote d'IvoireCroatiaCubaCyprusCzech RepublicDenmarkDjiboutiDominicaDominican RepublicEarly-demographic dividendEast Asia & PacificEast Asia & Pacific (excluding high income)East Asia & Pacific (IDA & IBRD countries)EcuadorEgypt, Arab Rep.El SalvadorEquatorial GuineaEritreaEstoniaEthiopiaEuro areaEurope & Central AsiaEurope & Central Asia (excluding high income)Europe & Central Asia (IDA & IBRD countries)European UnionFaroe IslandsFijiFinlandFragile and conflict affected situationsFranceGabonGambia, TheGeorgiaGermanyGhanaGreeceGrenadaGuatemalaGuineaGuinea-BissauGuyanaHaitiHeavily indebted poor countries (HIPC)High incomeHondurasHong Kong SAR, ChinaHungaryIBRD onlyIcelandIDA & IBRD totalIDA blendIDA onlyIDA totalIndiaIndonesiaIran, Islamic Rep.IraqIrelandIsraelItalyJamaicaJapanJordanKazakhstanKenyaKiribatiKorea, Rep.KosovoKuwaitKyrgyz RepublicLao PDRLate-demographic dividendLatin America & Caribbean Latin America & Caribbean (excluding high income)Latin America & the Caribbean (IDA & IBRD countries)LatviaLeast developed countries: UN classificationLebanonLesothoLiberiaLibyaLithuaniaLow & middle incomeLow incomeLower middle incomeLuxembourgMacao SAR, ChinaMacedonia, FYRMadagascarMalawiMalaysiaMaldivesMaliMaltaMauritaniaMauritiusMexicoMicronesia, Fed. Sts.Middle East & North AfricaMiddle East & North Africa (excluding high income)Middle East & North Africa (IDA & IBRD countries)Middle incomeMoldovaMongoliaMontenegroMoroccoMozambiqueNamibiaNepalNetherlandsNew CaledoniaNew ZealandNicaraguaNigerNigeriaNorth AmericaNorwayOECD membersOmanOther small statesPakistanPanamaPapua New GuineaParaguayPeruPhilippinesPolandPortugalPost-demographic dividendPre-demographic dividendPuerto RicoQatarRomaniaRussian FederationRwandaSaudi ArabiaSenegalSerbiaSeychellesSierra LeoneSingaporeSlovak RepublicSloveniaSmall statesSolomon IslandsSouth AfricaSouth AsiaSouth Asia (IDA & IBRD)South SudanSpainSri LankaSt. Kitts and NevisSt. LuciaSt. Vincent and the GrenadinesSub-Saharan Africa Sub-Saharan Africa (excluding high income)Sub-Saharan Africa (IDA & IBRD countries)SudanSurinameSwazilandSwedenSwitzerlandSyrian Arab RepublicTajikistanTanzaniaThailandTimor-LesteTogoTongaTrinidad and TobagoTunisiaTurkeyTurkmenistanUgandaUkraineUnited Arab EmiratesUnited KingdomUnited StatesUpper middle incomeUruguayUzbekistanVanuatuVenezuela, RBVietnamWest Bank and GazaWorldYemen, Rep.ZambiaZimbabwe Timeline:
This timeline shows a graph from 1986 to 2016 of Least developed countries: UN classification. No data until 1985. Number of actual observations by date: 31.
Source name:
World Development Indicators
Source organization:
World Bank national accounts data, and OECD National Accounts data files.
Categories, topics:
Economy & Growth
Last updated:
apr 23, 2017
Indicators value changes by year
Minimum:
109.038 bln
jan 1, 1986
Maximum:
828.285 bln
jan 1, 2016
At the date of observation
Value
Absolute change
Change from previous value
jan 1, 1986
109.038 bln
+109.038 bln
0.0%
jan 1, 1987
117.895 bln
+8.857 bln
8.12%
jan 1, 1988
129.36 bln
+11.465 bln
9.72%
jan 1, 1989
131.176 bln
+1.815 bln
1.4%
jan 1, 1990
137.173 bln
+5.997 bln
4.57%
jan 1, 1991
140.62 bln
+3.448 bln
2.51%
jan 1, 1992
141.064 bln
+443.787 mln
0.32%
jan 1, 1993
130.86 bln
-10.204 bln
-7.23%
jan 1, 1994
132.407 bln
+1.548 bln
1.18%
jan 1, 1995
127.944 bln
-4.463 bln
-3.37%
jan 1, 1996
146.149 bln
+18.205 bln
14.23%
jan 1, 1997
157.448 bln
+11.299 bln
7.73%
jan 1, 1998
167.71 bln
+10.261 bln
6.52%
jan 1, 1999
172.883 bln
+5.173 bln
3.08%
jan 1, 2000
172.47 bln
-412.961 mln
-0.24%
jan 1, 2001
188.456 bln
+15.986 bln
9.27%
jan 1, 2002
183.779 bln
-4.677 bln
-2.48%
jan 1, 2003
198.805 bln
+15.026 bln
8.18%
jan 1, 2004
220.965 bln
+22.16 bln
11.15%
jan 1, 2005
251.506 bln
+30.541 bln
13.82%
jan 1, 2006
286.34 bln
+34.834 bln
13.85%
jan 1, 2007
319.351 bln
+33.012 bln
11.53%
jan 1, 2008
390.024 bln
+70.673 bln
22.13%
jan 1, 2009
473.742 bln
+83.718 bln
21.46%
jan 1, 2010
514.881 bln
+41.139 bln
8.68%
jan 1, 2011
552.808 bln
+37.927 bln
7.37%
jan 1, 2012
618.614 bln
+65.806 bln
11.9%
jan 1, 2013
677.533 bln
+58.919 bln
9.52%
jan 1, 2014
748.653 bln
+71.12 bln
10.5%
jan 1, 2015
813.274 bln
+64.621 bln
8.63%
jan 1, 2016
828.285 bln
+15.011 bln
1.85%
Ranking of countries by current statistics by years


Comments: