29
/
en
AIzaSyAYiBZKx7MnpbEhh9jyipgxe19OcubqV5w
April 1, 2024
91138
Brazil
BRA
true
2
1
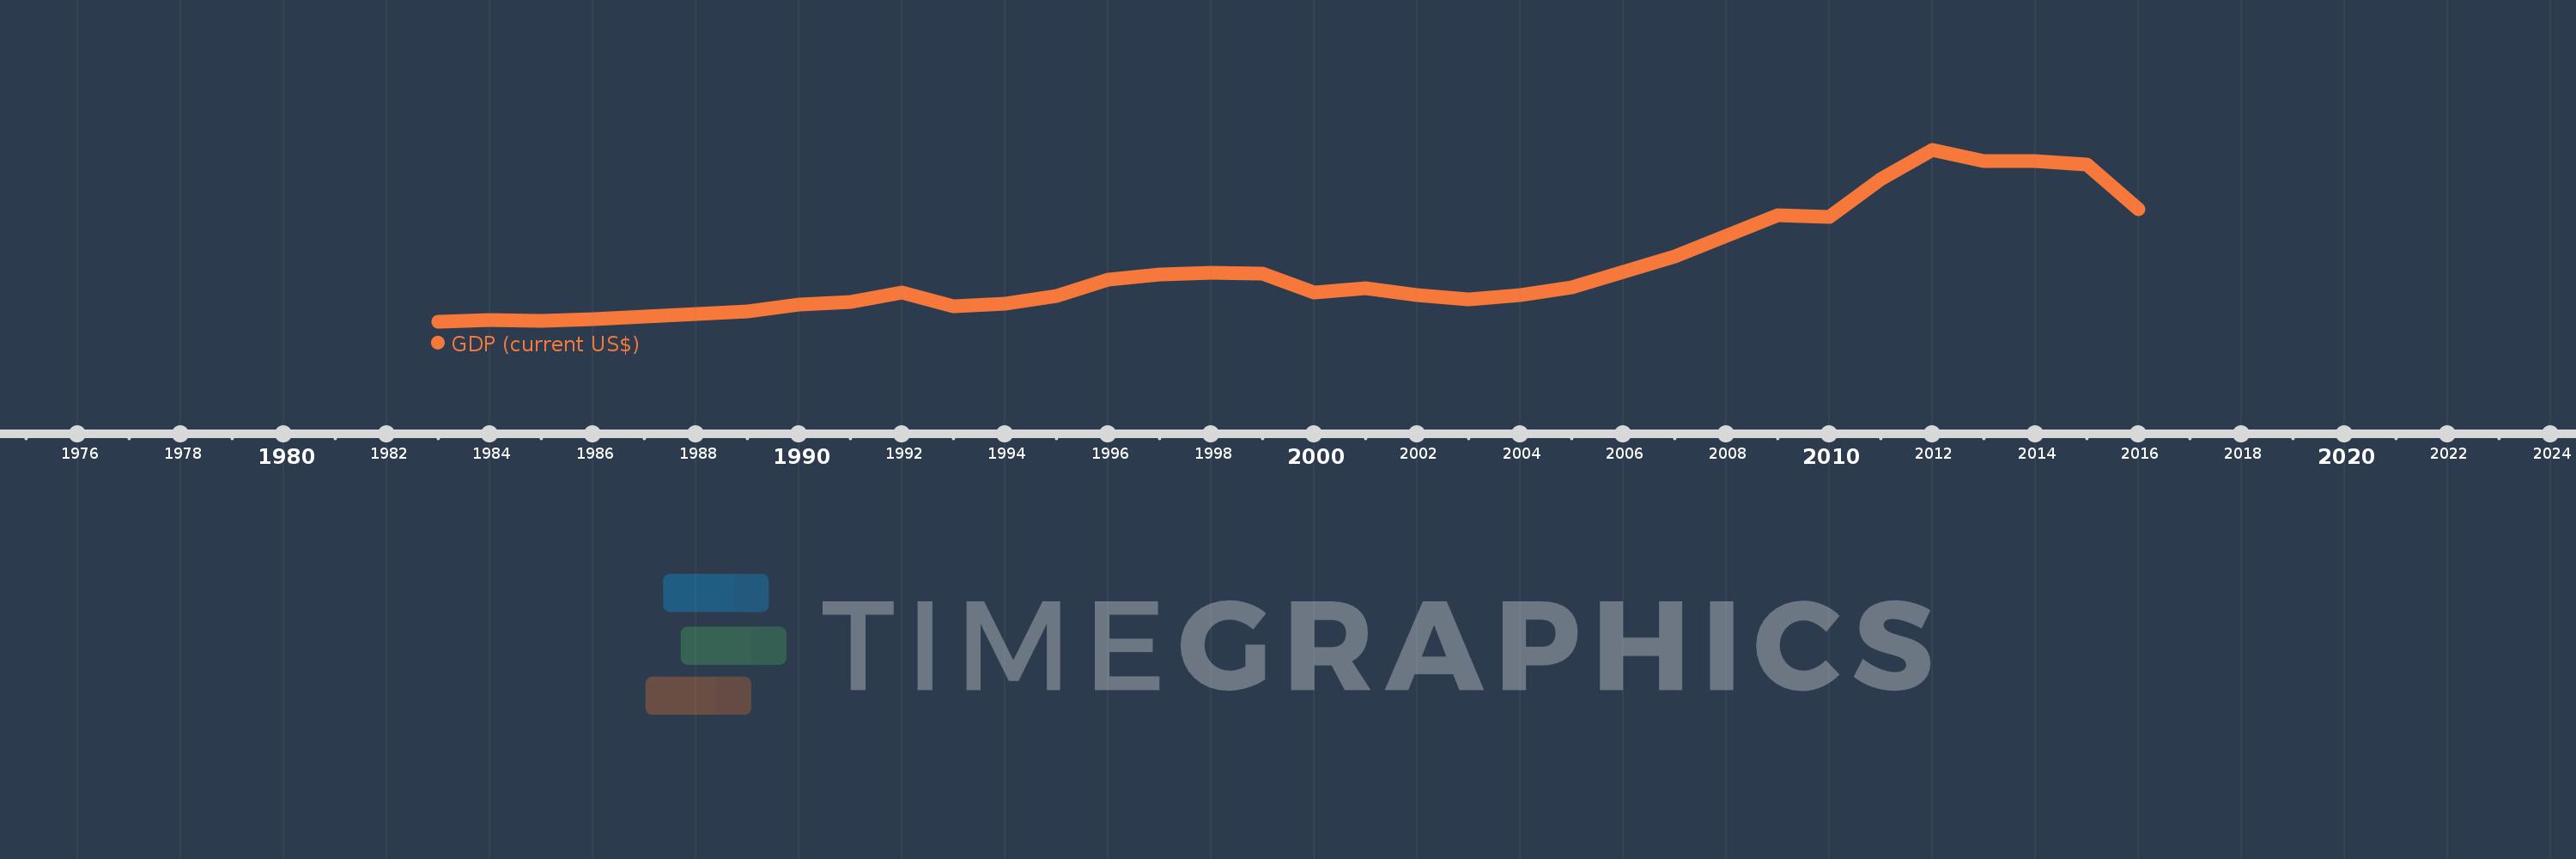
GDP (current US$)
2016,2015,2014,2013,2012,2011,2010,2009,2008,2007,2006,2005,2004,2003,2002,2001,2000,1999,1998,1997,1996,1995,1994,1993,1992,1991,1990,1989,1988,1987,1986,1985,1984,1983
This statistics in other country:
AfghanistanAlbaniaAlgeriaAndorraAngolaAntigua and BarbudaArab WorldArgentinaArmeniaArubaAustraliaAustriaAzerbaijanBahamas, TheBahrainBangladeshBarbadosBelarusBelgiumBelizeBeninBermudaBhutanBoliviaBosnia and HerzegovinaBotswanaBrazilBrunei DarussalamBulgariaBurkina FasoBurundiCabo VerdeCambodiaCameroonCanadaCaribbean small statesCayman IslandsCentral African RepublicCentral Europe and the BalticsChadChannel IslandsChileChinaColombiaComorosCongo, Dem. Rep.Congo, Rep.Costa RicaCote d'IvoireCroatiaCubaCyprusCzech RepublicDenmarkDjiboutiDominicaDominican RepublicEarly-demographic dividendEast Asia & PacificEast Asia & Pacific (excluding high income)East Asia & Pacific (IDA & IBRD countries)EcuadorEgypt, Arab Rep.El SalvadorEquatorial GuineaEritreaEstoniaEthiopiaEuro areaEurope & Central AsiaEurope & Central Asia (excluding high income)Europe & Central Asia (IDA & IBRD countries)European UnionFaroe IslandsFijiFinlandFragile and conflict affected situationsFranceFrench PolynesiaGabonGambia, TheGeorgiaGermanyGhanaGreeceGreenlandGrenadaGuatemalaGuineaGuinea-BissauGuyanaHaitiHeavily indebted poor countries (HIPC)High incomeHondurasHong Kong SAR, ChinaHungaryIBRD onlyIcelandIDA & IBRD totalIDA blendIDA onlyIDA totalIndiaIndonesiaIran, Islamic Rep.IraqIrelandIsle of ManIsraelItalyJamaicaJapanJordanKazakhstanKenyaKiribatiKorea, Rep.KosovoKuwaitKyrgyz RepublicLao PDRLate-demographic dividendLatin America & Caribbean Latin America & Caribbean (excluding high income)Latin America & the Caribbean (IDA & IBRD countries)LatviaLeast developed countries: UN classificationLebanonLesothoLiberiaLibyaLiechtensteinLithuaniaLow & middle incomeLow incomeLower middle incomeLuxembourgMacao SAR, ChinaMacedonia, FYRMadagascarMalawiMalaysiaMaldivesMaliMaltaMarshall IslandsMauritaniaMauritiusMexicoMicronesia, Fed. Sts.Middle East & North AfricaMiddle East & North Africa (excluding high income)Middle East & North Africa (IDA & IBRD countries)Middle incomeMoldovaMonacoMongoliaMontenegroMoroccoMozambiqueMyanmarNamibiaNauruNepalNetherlandsNew CaledoniaNew ZealandNicaraguaNigerNigeriaNorth AmericaNorwayOECD membersOmanOther small statesPacific island small statesPakistanPalauPanamaPapua New GuineaParaguayPeruPhilippinesPolandPortugalPost-demographic dividendPre-demographic dividendPuerto RicoQatarRomaniaRussian FederationRwandaSamoaSan MarinoSao Tome and PrincipeSaudi ArabiaSenegalSerbiaSeychellesSierra LeoneSingaporeSlovak RepublicSloveniaSmall statesSolomon IslandsSomaliaSouth AfricaSouth AsiaSouth Asia (IDA & IBRD)South SudanSpainSri LankaSt. Kitts and NevisSt. LuciaSt. Vincent and the GrenadinesSub-Saharan Africa Sub-Saharan Africa (excluding high income)Sub-Saharan Africa (IDA & IBRD countries)SudanSurinameSwazilandSwedenSwitzerlandSyrian Arab RepublicTajikistanTanzaniaThailandTimor-LesteTogoTongaTrinidad and TobagoTunisiaTurkeyTurkmenistanTuvaluUgandaUkraineUnited Arab EmiratesUnited KingdomUnited StatesUpper middle incomeUruguayUzbekistanVanuatuVenezuela, RBVietnamVirgin Islands (U.S.)West Bank and GazaWorldYemen, Rep.ZambiaZimbabwe Timeline:
This timeline shows a graph from 1983 to 2016 of Brazil. No data until 1982. Number of actual observations by date: 34.
Source name:
World Development Indicators
Source organization:
World Bank national accounts data, and OECD National Accounts data files.
Categories, topics:
Economy & Growth
Last updated:
apr 23, 2017
Indicators value changes by year
Minimum:
183.786 bln
jan 1, 1983
Maximum:
2.615 trl
jan 1, 2012
At the date of observation
Value
Absolute change
Change from previous value
jan 1, 1983
183.786 bln
+183.786 bln
0.0%
jan 1, 1984
213.196 bln
+29.411 bln
16.0%
jan 1, 1985
200.567 bln
-12.629 bln
-5.92%
jan 1, 1986
218.581 bln
+18.014 bln
8.98%
jan 1, 1987
266.314 bln
+47.733 bln
21.84%
jan 1, 1988
293.364 bln
+27.05 bln
10.16%
jan 1, 1989
330.301 bln
+36.937 bln
12.59%
jan 1, 1990
425.595 bln
+95.294 bln
28.85%
jan 1, 1991
461.952 bln
+36.356 bln
8.54%
jan 1, 1992
602.86 bln
+140.908 bln
30.5%
jan 1, 1993
400.599 bln
-202.261 bln
-33.55%
jan 1, 1994
437.799 bln
+37.199 bln
9.29%
jan 1, 1995
558.112 bln
+120.313 bln
27.48%
jan 1, 1996
785.643 bln
+227.531 bln
40.77%
jan 1, 1997
850.426 bln
+64.782 bln
8.25%
jan 1, 1998
883.199 bln
+32.774 bln
3.85%
jan 1, 1999
863.723 bln
-19.476 bln
-2.21%
jan 1, 2000
599.389 bln
-264.335 bln
-30.6%
jan 1, 2001
655.421 bln
+56.032 bln
9.35%
jan 1, 2002
559.373 bln
-96.049 bln
-14.65%
jan 1, 2003
507.963 bln
-51.41 bln
-9.19%
jan 1, 2004
558.32 bln
+50.357 bln
9.91%
jan 1, 2005
669.316 bln
+110.996 bln
19.88%
jan 1, 2006
891.63 bln
+222.314 bln
33.22%
jan 1, 2007
1.108 trl
+216.01 bln
24.23%
jan 1, 2008
1.397 trl
+289.444 bln
26.13%
jan 1, 2009
1.696 trl
+298.74 bln
21.38%
jan 1, 2010
1.667 trl
-28.804 bln
-1.7%
jan 1, 2011
2.209 trl
+541.852 bln
32.5%
jan 1, 2012
2.615 trl
+405.701 bln
18.37%
jan 1, 2013
2.461 trl
-153.915 bln
-5.89%
jan 1, 2014
2.466 trl
+5.115 bln
0.21%
jan 1, 2015
2.417 trl
-48.728 bln
-1.98%
jan 1, 2016
1.775 trl
-642.322 bln
-26.57%
Ranking of countries by current statistics by years


Comments: