29
/
en
AIzaSyAYiBZKx7MnpbEhh9jyipgxe19OcubqV5w
April 1, 2024
266834
Trinidad and Tobago
TTO
true
2
1
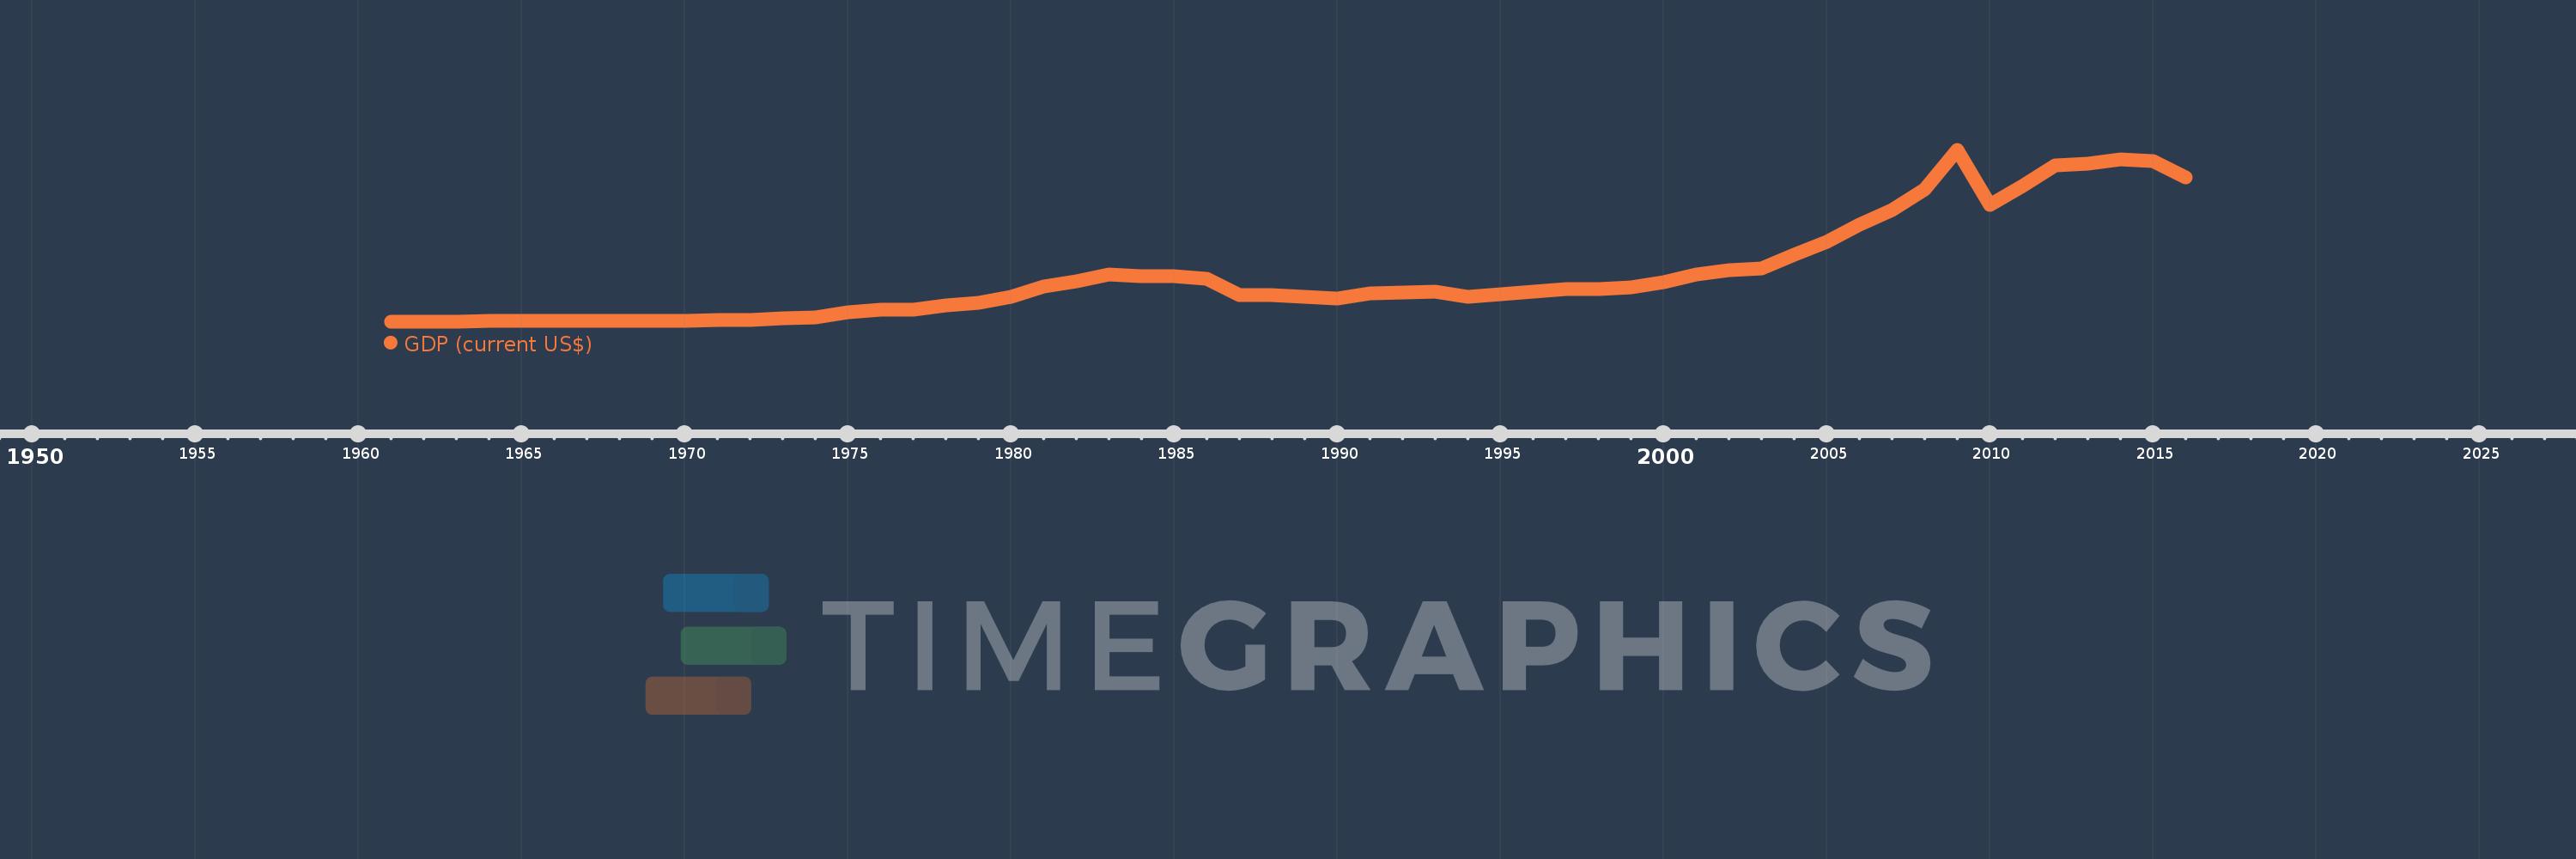
GDP (current US$)
2016,2015,2014,2013,2012,2011,2010,2009,2008,2007,2006,2005,2004,2003,2002,2001,2000,1999,1998,1997,1996,1995,1994,1993,1992,1991,1990,1989,1988,1987,1986,1985,1984,1983,1982,1981,1980,1979,1978,1977,1976,1975,1974,1973,1972,1971,1970,1969,1968,1967,1966,1965,1964,1963,1962,1961
This statistics in other country:
AfghanistanAlbaniaAlgeriaAndorraAngolaAntigua and BarbudaArab WorldArgentinaArmeniaArubaAustraliaAustriaAzerbaijanBahamas, TheBahrainBangladeshBarbadosBelarusBelgiumBelizeBeninBermudaBhutanBoliviaBosnia and HerzegovinaBotswanaBrazilBrunei DarussalamBulgariaBurkina FasoBurundiCabo VerdeCambodiaCameroonCanadaCaribbean small statesCayman IslandsCentral African RepublicCentral Europe and the BalticsChadChannel IslandsChileChinaColombiaComorosCongo, Dem. Rep.Congo, Rep.Costa RicaCote d'IvoireCroatiaCubaCyprusCzech RepublicDenmarkDjiboutiDominicaDominican RepublicEarly-demographic dividendEast Asia & PacificEast Asia & Pacific (excluding high income)East Asia & Pacific (IDA & IBRD countries)EcuadorEgypt, Arab Rep.El SalvadorEquatorial GuineaEritreaEstoniaEthiopiaEuro areaEurope & Central AsiaEurope & Central Asia (excluding high income)Europe & Central Asia (IDA & IBRD countries)European UnionFaroe IslandsFijiFinlandFragile and conflict affected situationsFranceFrench PolynesiaGabonGambia, TheGeorgiaGermanyGhanaGreeceGreenlandGrenadaGuatemalaGuineaGuinea-BissauGuyanaHaitiHeavily indebted poor countries (HIPC)High incomeHondurasHong Kong SAR, ChinaHungaryIBRD onlyIcelandIDA & IBRD totalIDA blendIDA onlyIDA totalIndiaIndonesiaIran, Islamic Rep.IraqIrelandIsle of ManIsraelItalyJamaicaJapanJordanKazakhstanKenyaKiribatiKorea, Rep.KosovoKuwaitKyrgyz RepublicLao PDRLate-demographic dividendLatin America & Caribbean Latin America & Caribbean (excluding high income)Latin America & the Caribbean (IDA & IBRD countries)LatviaLeast developed countries: UN classificationLebanonLesothoLiberiaLibyaLiechtensteinLithuaniaLow & middle incomeLow incomeLower middle incomeLuxembourgMacao SAR, ChinaMacedonia, FYRMadagascarMalawiMalaysiaMaldivesMaliMaltaMarshall IslandsMauritaniaMauritiusMexicoMicronesia, Fed. Sts.Middle East & North AfricaMiddle East & North Africa (excluding high income)Middle East & North Africa (IDA & IBRD countries)Middle incomeMoldovaMonacoMongoliaMontenegroMoroccoMozambiqueMyanmarNamibiaNauruNepalNetherlandsNew CaledoniaNew ZealandNicaraguaNigerNigeriaNorth AmericaNorwayOECD membersOmanOther small statesPacific island small statesPakistanPalauPanamaPapua New GuineaParaguayPeruPhilippinesPolandPortugalPost-demographic dividendPre-demographic dividendPuerto RicoQatarRomaniaRussian FederationRwandaSamoaSan MarinoSao Tome and PrincipeSaudi ArabiaSenegalSerbiaSeychellesSierra LeoneSingaporeSlovak RepublicSloveniaSmall statesSolomon IslandsSomaliaSouth AfricaSouth AsiaSouth Asia (IDA & IBRD)South SudanSpainSri LankaSt. Kitts and NevisSt. LuciaSt. Vincent and the GrenadinesSub-Saharan Africa Sub-Saharan Africa (excluding high income)Sub-Saharan Africa (IDA & IBRD countries)SudanSurinameSwazilandSwedenSwitzerlandSyrian Arab RepublicTajikistanTanzaniaThailandTimor-LesteTogoTongaTrinidad and TobagoTunisiaTurkeyTurkmenistanTuvaluUgandaUkraineUnited Arab EmiratesUnited KingdomUnited StatesUpper middle incomeUruguayUzbekistanVanuatuVenezuela, RBVietnamVirgin Islands (U.S.)West Bank and GazaWorldYemen, Rep.ZambiaZimbabwe Timeline:
This timeline shows a graph from 1961 to 2016 of Trinidad and Tobago. No data until 1960. Number of actual observations by date: 56.
Source name:
World Development Indicators
Source organization:
World Bank national accounts data, and OECD National Accounts data files.
Categories, topics:
Economy & Growth
Last updated:
apr 23, 2017
Indicators value changes by year
Minimum:
535.67 mln
jan 1, 1961
Maximum:
27.87 bln
jan 1, 2009
At the date of observation
Value
Absolute change
Change from previous value
jan 1, 1961
535.67 mln
+535.67 mln
0.0%
jan 1, 1962
584.961 mln
+49.291 mln
9.2%
jan 1, 1963
619.319 mln
+34.358 mln
5.87%
jan 1, 1964
678.235 mln
+58.916 mln
9.51%
jan 1, 1965
711.893 mln
+33.658 mln
4.96%
jan 1, 1966
736.569 mln
+24.675 mln
3.47%
jan 1, 1967
723.736 mln
-12.833 mln
-1.74%
jan 1, 1968
761.981 mln
+38.246 mln
5.28%
jan 1, 1969
758.9 mln
-3.082 mln
-0.4%
jan 1, 1970
779.2 mln
+20.3 mln
2.67%
jan 1, 1971
821.85 mln
+42.65 mln
5.47%
jan 1, 1972
896.754 mln
+74.904 mln
9.11%
jan 1, 1973
1.083 bln
+186.627 mln
20.81%
jan 1, 1974
1.309 bln
+225.418 mln
20.81%
jan 1, 1975
2.042 bln
+733.232 mln
56.02%
jan 1, 1976
2.443 bln
+400.636 mln
19.62%
jan 1, 1977
2.5 bln
+57.743 mln
2.36%
jan 1, 1978
3.139 bln
+638.256 mln
25.53%
jan 1, 1979
3.562 bln
+423.667 mln
13.5%
jan 1, 1980
4.602 bln
+1.04 bln
29.2%
jan 1, 1981
6.236 bln
+1.633 bln
35.49%
jan 1, 1982
6.992 bln
+756.25 mln
12.13%
jan 1, 1983
8.14 bln
+1.148 bln
16.42%
jan 1, 1984
7.764 bln
-376.667 mln
-4.63%
jan 1, 1985
7.757 bln
-6.667 mln
-0.09%
jan 1, 1986
7.376 bln
-381.165 mln
-4.91%
jan 1, 1987
4.794 bln
-2.581 bln
-35.0%
jan 1, 1988
4.798 bln
+3.333 mln
0.07%
jan 1, 1989
4.497 bln
-300.926 mln
-6.27%
jan 1, 1990
4.323 bln
-173.793 mln
-3.86%
jan 1, 1991
5.068 bln
+744.941 mln
17.23%
jan 1, 1992
5.203 bln
+135.224 mln
2.67%
jan 1, 1993
5.318 bln
+115.035 mln
2.21%
jan 1, 1994
4.581 bln
-736.902 mln
-13.86%
jan 1, 1995
4.947 bln
+365.849 mln
7.99%
jan 1, 1996
5.329 bln
+382.008 mln
7.72%
jan 1, 1997
5.76 bln
+430.324 mln
8.07%
jan 1, 1998
5.738 bln
-21.786 mln
-0.38%
jan 1, 1999
6.044 bln
+305.943 mln
5.33%
jan 1, 2000
6.809 bln
+765.288 mln
12.66%
jan 1, 2001
8.154 bln
+1.345 bln
19.76%
jan 1, 2002
8.825 bln
+670.535 mln
8.22%
jan 1, 2003
9.008 bln
+183.4 mln
2.08%
jan 1, 2004
11.305 bln
+2.297 bln
25.5%
jan 1, 2005
13.28 bln
+1.975 bln
17.47%
jan 1, 2006
15.982 bln
+2.702 bln
20.35%
jan 1, 2007
18.369 bln
+2.387 bln
14.93%
jan 1, 2008
21.642 bln
+3.273 bln
17.82%
jan 1, 2009
27.87 bln
+6.228 bln
28.78%
jan 1, 2010
19.175 bln
-8.695 bln
-31.2%
jan 1, 2011
22.158 bln
+2.983 bln
15.56%
jan 1, 2012
25.433 bln
+3.275 bln
14.78%
jan 1, 2013
25.694 bln
+261.153 mln
1.03%
jan 1, 2014
26.436 bln
+742.057 mln
2.89%
jan 1, 2015
26.176 bln
-260.315 mln
-0.98%
jan 1, 2016
23.559 bln
-2.617 bln
-10.0%
Ranking of countries by current statistics by years


Comments: