29
/
en
AIzaSyAYiBZKx7MnpbEhh9jyipgxe19OcubqV5w
April 1, 2024
274762
United Arab Emirates
ARE
true
2
1
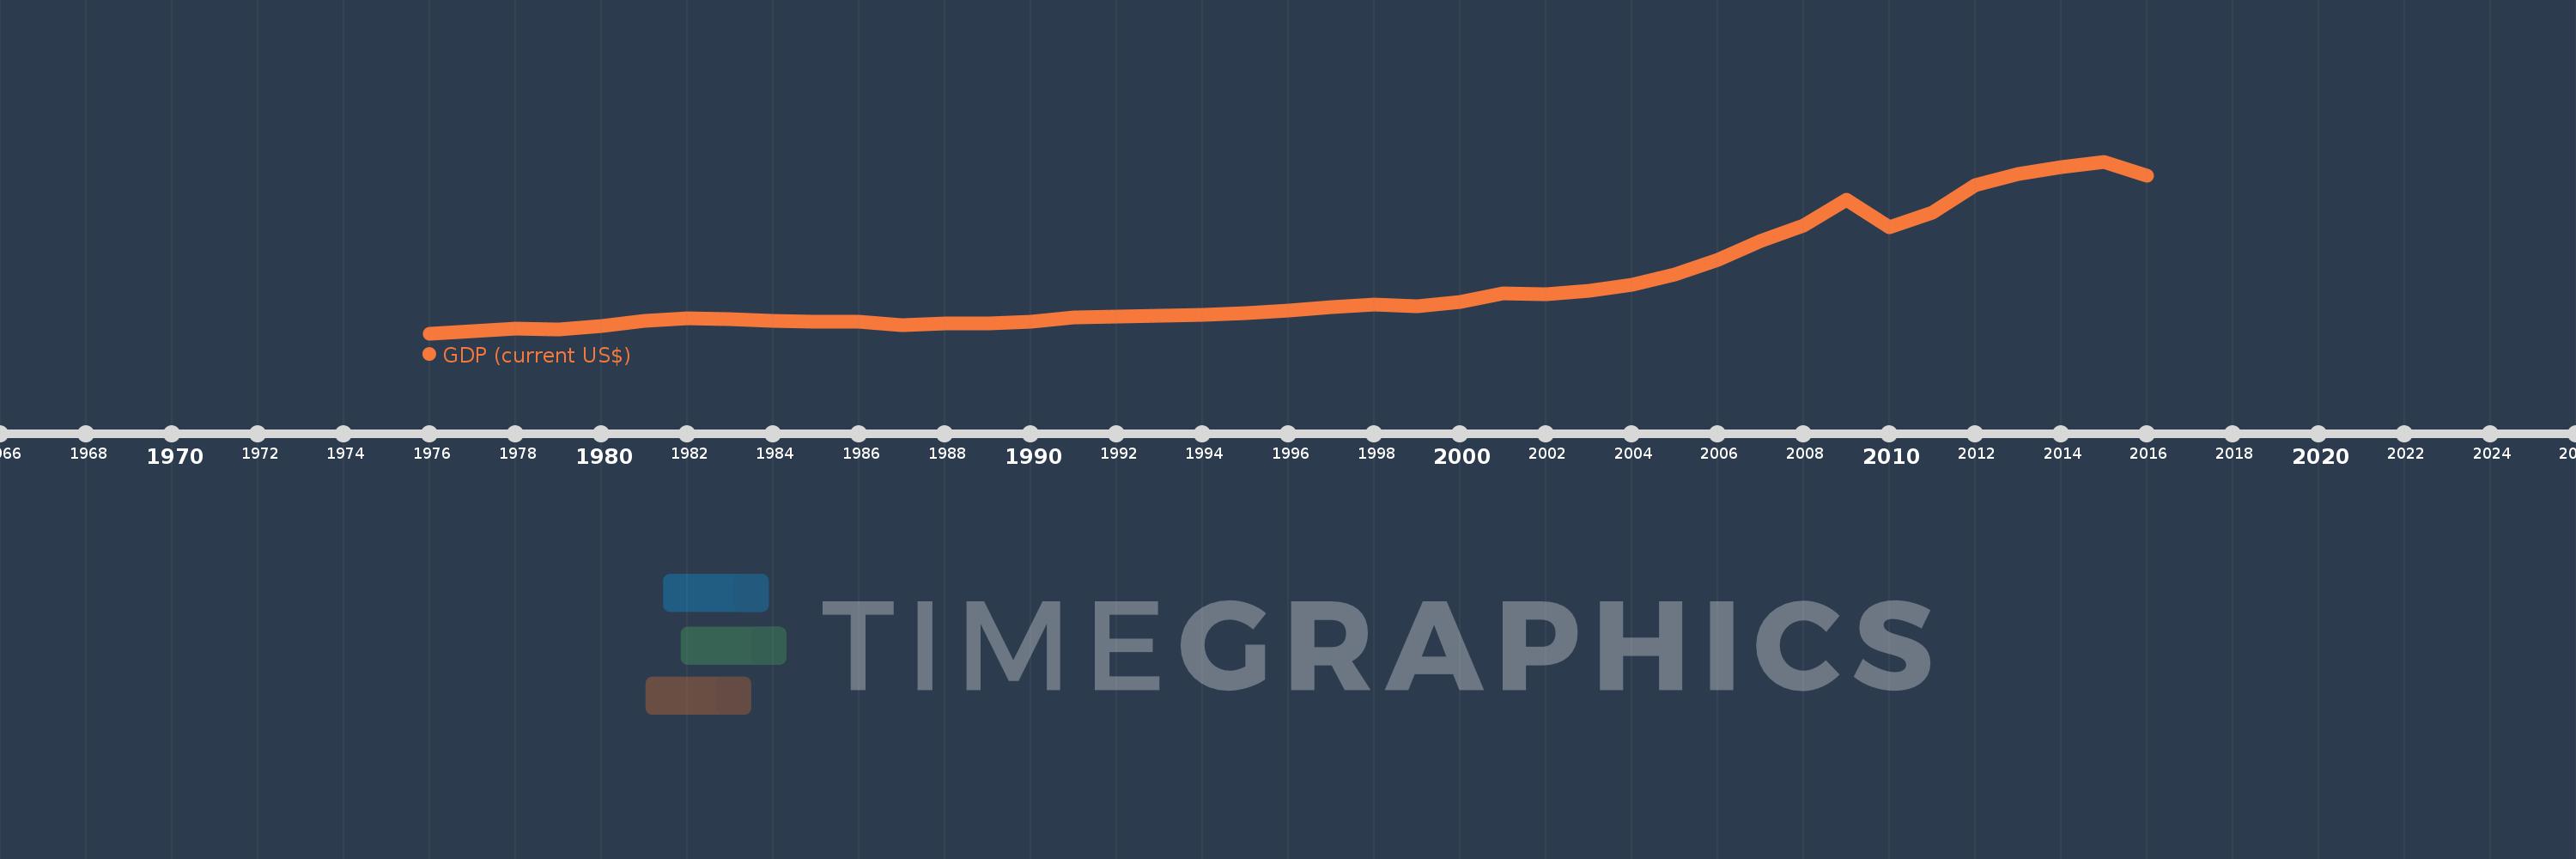
GDP (current US$)
2016,2015,2014,2013,2012,2011,2010,2009,2008,2007,2006,2005,2004,2003,2002,2001,2000,1999,1998,1997,1996,1995,1994,1993,1992,1991,1990,1989,1988,1987,1986,1985,1984,1983,1982,1981,1980,1979,1978,1977,1976
This statistics in other country:
AfghanistanAlbaniaAlgeriaAndorraAngolaAntigua and BarbudaArab WorldArgentinaArmeniaArubaAustraliaAustriaAzerbaijanBahamas, TheBahrainBangladeshBarbadosBelarusBelgiumBelizeBeninBermudaBhutanBoliviaBosnia and HerzegovinaBotswanaBrazilBrunei DarussalamBulgariaBurkina FasoBurundiCabo VerdeCambodiaCameroonCanadaCaribbean small statesCayman IslandsCentral African RepublicCentral Europe and the BalticsChadChannel IslandsChileChinaColombiaComorosCongo, Dem. Rep.Congo, Rep.Costa RicaCote d'IvoireCroatiaCubaCyprusCzech RepublicDenmarkDjiboutiDominicaDominican RepublicEarly-demographic dividendEast Asia & PacificEast Asia & Pacific (excluding high income)East Asia & Pacific (IDA & IBRD countries)EcuadorEgypt, Arab Rep.El SalvadorEquatorial GuineaEritreaEstoniaEthiopiaEuro areaEurope & Central AsiaEurope & Central Asia (excluding high income)Europe & Central Asia (IDA & IBRD countries)European UnionFaroe IslandsFijiFinlandFragile and conflict affected situationsFranceFrench PolynesiaGabonGambia, TheGeorgiaGermanyGhanaGreeceGreenlandGrenadaGuatemalaGuineaGuinea-BissauGuyanaHaitiHeavily indebted poor countries (HIPC)High incomeHondurasHong Kong SAR, ChinaHungaryIBRD onlyIcelandIDA & IBRD totalIDA blendIDA onlyIDA totalIndiaIndonesiaIran, Islamic Rep.IraqIrelandIsle of ManIsraelItalyJamaicaJapanJordanKazakhstanKenyaKiribatiKorea, Rep.KosovoKuwaitKyrgyz RepublicLao PDRLate-demographic dividendLatin America & Caribbean Latin America & Caribbean (excluding high income)Latin America & the Caribbean (IDA & IBRD countries)LatviaLeast developed countries: UN classificationLebanonLesothoLiberiaLibyaLiechtensteinLithuaniaLow & middle incomeLow incomeLower middle incomeLuxembourgMacao SAR, ChinaMacedonia, FYRMadagascarMalawiMalaysiaMaldivesMaliMaltaMarshall IslandsMauritaniaMauritiusMexicoMicronesia, Fed. Sts.Middle East & North AfricaMiddle East & North Africa (excluding high income)Middle East & North Africa (IDA & IBRD countries)Middle incomeMoldovaMonacoMongoliaMontenegroMoroccoMozambiqueMyanmarNamibiaNauruNepalNetherlandsNew CaledoniaNew ZealandNicaraguaNigerNigeriaNorth AmericaNorwayOECD membersOmanOther small statesPacific island small statesPakistanPalauPanamaPapua New GuineaParaguayPeruPhilippinesPolandPortugalPost-demographic dividendPre-demographic dividendPuerto RicoQatarRomaniaRussian FederationRwandaSamoaSan MarinoSao Tome and PrincipeSaudi ArabiaSenegalSerbiaSeychellesSierra LeoneSingaporeSlovak RepublicSloveniaSmall statesSolomon IslandsSomaliaSouth AfricaSouth AsiaSouth Asia (IDA & IBRD)South SudanSpainSri LankaSt. Kitts and NevisSt. LuciaSt. Vincent and the GrenadinesSub-Saharan Africa Sub-Saharan Africa (excluding high income)Sub-Saharan Africa (IDA & IBRD countries)SudanSurinameSwazilandSwedenSwitzerlandSyrian Arab RepublicTajikistanTanzaniaThailandTimor-LesteTogoTongaTrinidad and TobagoTunisiaTurkeyTurkmenistanTuvaluUgandaUkraineUnited Arab EmiratesUnited KingdomUnited StatesUpper middle incomeUruguayUzbekistanVanuatuVenezuela, RBVietnamVirgin Islands (U.S.)West Bank and GazaWorldYemen, Rep.ZambiaZimbabwe Timeline:
This timeline shows a graph from 1976 to 2016 of United Arab Emirates. No data until 1975. Number of actual observations by date: 41.
Source name:
World Development Indicators
Source organization:
World Bank national accounts data, and OECD National Accounts data files.
Categories, topics:
Economy & Growth
Last updated:
apr 23, 2017
Indicators value changes by year
Minimum:
14.721 bln
jan 1, 1976
Maximum:
401.958 bln
jan 1, 2015
At the date of observation
Value
Absolute change
Change from previous value
jan 1, 1976
14.721 bln
+14.721 bln
0.0%
jan 1, 1977
19.213 bln
+4.492 bln
30.52%
jan 1, 1978
24.872 bln
+5.659 bln
29.45%
jan 1, 1979
23.776 bln
-1.096 bln
-4.41%
jan 1, 1980
31.225 bln
+7.45 bln
31.33%
jan 1, 1981
43.599 bln
+12.373 bln
39.63%
jan 1, 1982
49.333 bln
+5.735 bln
13.15%
jan 1, 1983
46.623 bln
-2.711 bln
-5.49%
jan 1, 1984
42.803 bln
-3.819 bln
-8.19%
jan 1, 1985
41.808 bln
-995.369 mln
-2.33%
jan 1, 1986
40.604 bln
-1.204 bln
-2.88%
jan 1, 1987
33.944 bln
-6.66 bln
-16.4%
jan 1, 1988
36.385 bln
+2.441 bln
7.19%
jan 1, 1989
36.276 bln
-109.235 mln
-0.3%
jan 1, 1990
41.465 bln
+5.189 bln
14.31%
jan 1, 1991
50.701 bln
+9.236 bln
22.28%
jan 1, 1992
51.552 bln
+850.722 mln
1.68%
jan 1, 1993
54.239 bln
+2.687 bln
5.21%
jan 1, 1994
55.625 bln
+1.386 bln
2.56%
jan 1, 1995
59.305 bln
+3.68 bln
6.62%
jan 1, 1996
65.744 bln
+6.439 bln
10.86%
jan 1, 1997
73.571 bln
+7.828 bln
11.91%
jan 1, 1998
78.839 bln
+5.268 bln
7.16%
jan 1, 1999
75.674 bln
-3.165 bln
-4.01%
jan 1, 2000
84.445 bln
+8.771 bln
11.59%
jan 1, 2001
104.337 bln
+19.892 bln
23.56%
jan 1, 2002
103.312 bln
-1.026 bln
-0.98%
jan 1, 2003
109.816 bln
+6.505 bln
6.3%
jan 1, 2004
124.346 bln
+14.53 bln
13.23%
jan 1, 2005
147.824 bln
+23.478 bln
18.88%
jan 1, 2006
180.617 bln
+32.793 bln
22.18%
jan 1, 2007
222.106 bln
+41.489 bln
22.97%
jan 1, 2008
257.916 bln
+35.81 bln
16.12%
jan 1, 2009
315.475 bln
+57.558 bln
22.32%
jan 1, 2010
253.547 bln
-61.927 bln
-19.63%
jan 1, 2011
286.049 bln
+32.502 bln
12.82%
jan 1, 2012
348.526 bln
+62.477 bln
21.84%
jan 1, 2013
373.432 bln
+24.906 bln
7.15%
jan 1, 2014
388.599 bln
+15.167 bln
4.06%
jan 1, 2015
401.958 bln
+13.36 bln
3.44%
jan 1, 2016
370.296 bln
-31.662 bln
-7.88%
Ranking of countries by current statistics by years


Comments: