29
/
en
AIzaSyAYiBZKx7MnpbEhh9jyipgxe19OcubqV5w
April 1, 2024
67150
Andorra
AND
true
2
1
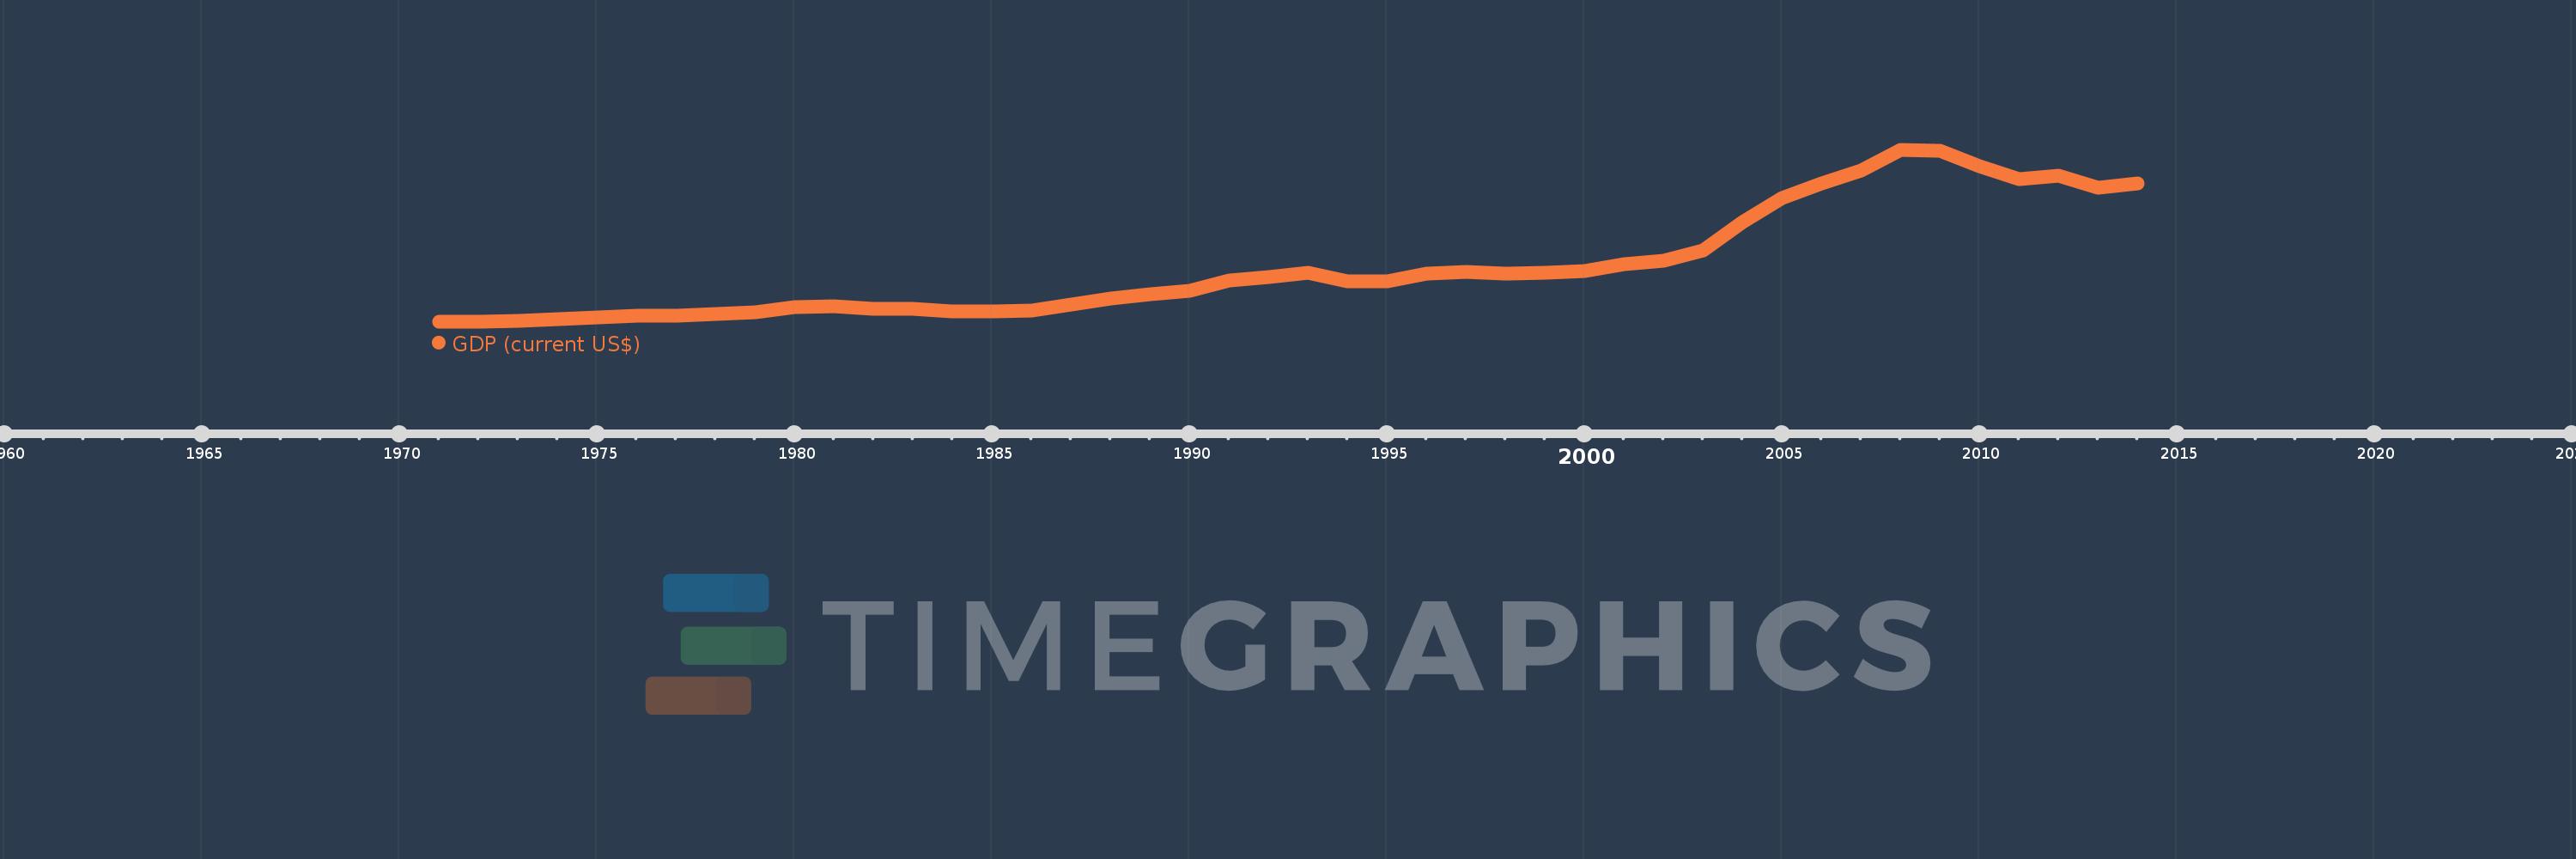
GDP (current US$)
2014,2013,2012,2011,2010,2009,2008,2007,2006,2005,2004,2003,2002,2001,2000,1999,1998,1997,1996,1995,1994,1993,1992,1991,1990,1989,1988,1987,1986,1985,1984,1983,1982,1981,1980,1979,1978,1977,1976,1975,1974,1973,1972,1971
This statistics in other country:
AfghanistanAlbaniaAlgeriaAndorraAngolaAntigua and BarbudaArab WorldArgentinaArmeniaArubaAustraliaAustriaAzerbaijanBahamas, TheBahrainBangladeshBarbadosBelarusBelgiumBelizeBeninBermudaBhutanBoliviaBosnia and HerzegovinaBotswanaBrazilBrunei DarussalamBulgariaBurkina FasoBurundiCabo VerdeCambodiaCameroonCanadaCaribbean small statesCayman IslandsCentral African RepublicCentral Europe and the BalticsChadChannel IslandsChileChinaColombiaComorosCongo, Dem. Rep.Congo, Rep.Costa RicaCote d'IvoireCroatiaCubaCyprusCzech RepublicDenmarkDjiboutiDominicaDominican RepublicEarly-demographic dividendEast Asia & PacificEast Asia & Pacific (excluding high income)East Asia & Pacific (IDA & IBRD countries)EcuadorEgypt, Arab Rep.El SalvadorEquatorial GuineaEritreaEstoniaEthiopiaEuro areaEurope & Central AsiaEurope & Central Asia (excluding high income)Europe & Central Asia (IDA & IBRD countries)European UnionFaroe IslandsFijiFinlandFragile and conflict affected situationsFranceFrench PolynesiaGabonGambia, TheGeorgiaGermanyGhanaGreeceGreenlandGrenadaGuatemalaGuineaGuinea-BissauGuyanaHaitiHeavily indebted poor countries (HIPC)High incomeHondurasHong Kong SAR, ChinaHungaryIBRD onlyIcelandIDA & IBRD totalIDA blendIDA onlyIDA totalIndiaIndonesiaIran, Islamic Rep.IraqIrelandIsle of ManIsraelItalyJamaicaJapanJordanKazakhstanKenyaKiribatiKorea, Rep.KosovoKuwaitKyrgyz RepublicLao PDRLate-demographic dividendLatin America & Caribbean Latin America & Caribbean (excluding high income)Latin America & the Caribbean (IDA & IBRD countries)LatviaLeast developed countries: UN classificationLebanonLesothoLiberiaLibyaLiechtensteinLithuaniaLow & middle incomeLow incomeLower middle incomeLuxembourgMacao SAR, ChinaMacedonia, FYRMadagascarMalawiMalaysiaMaldivesMaliMaltaMarshall IslandsMauritaniaMauritiusMexicoMicronesia, Fed. Sts.Middle East & North AfricaMiddle East & North Africa (excluding high income)Middle East & North Africa (IDA & IBRD countries)Middle incomeMoldovaMonacoMongoliaMontenegroMoroccoMozambiqueMyanmarNamibiaNauruNepalNetherlandsNew CaledoniaNew ZealandNicaraguaNigerNigeriaNorth AmericaNorwayOECD membersOmanOther small statesPacific island small statesPakistanPalauPanamaPapua New GuineaParaguayPeruPhilippinesPolandPortugalPost-demographic dividendPre-demographic dividendPuerto RicoQatarRomaniaRussian FederationRwandaSamoaSan MarinoSao Tome and PrincipeSaudi ArabiaSenegalSerbiaSeychellesSierra LeoneSingaporeSlovak RepublicSloveniaSmall statesSolomon IslandsSomaliaSouth AfricaSouth AsiaSouth Asia (IDA & IBRD)South SudanSpainSri LankaSt. Kitts and NevisSt. LuciaSt. Vincent and the GrenadinesSub-Saharan Africa Sub-Saharan Africa (excluding high income)Sub-Saharan Africa (IDA & IBRD countries)SudanSurinameSwazilandSwedenSwitzerlandSyrian Arab RepublicTajikistanTanzaniaThailandTimor-LesteTogoTongaTrinidad and TobagoTunisiaTurkeyTurkmenistanTuvaluUgandaUkraineUnited Arab EmiratesUnited KingdomUnited StatesUpper middle incomeUruguayUzbekistanVanuatuVenezuela, RBVietnamVirgin Islands (U.S.)West Bank and GazaWorldYemen, Rep.ZambiaZimbabwe Timeline:
This timeline shows a graph from 1971 to 2014 of Andorra. No data until 1970. Number of actual observations by date: 44.
Source name:
World Development Indicators
Source organization:
World Bank national accounts data, and OECD National Accounts data files.
Categories, topics:
Economy & Growth
Last updated:
apr 23, 2017
Indicators value changes by year
Minimum:
78.619 mln
jan 1, 1971
Maximum:
4.011 bln
jan 1, 2008
At the date of observation
Value
Absolute change
Change from previous value
jan 1, 1971
78.619 mln
+78.619 mln
0.0%
jan 1, 1972
89.41 mln
+10.791 mln
13.73%
jan 1, 1973
113.408 mln
+23.998 mln
26.84%
jan 1, 1974
150.82 mln
+37.412 mln
32.99%
jan 1, 1975
186.559 mln
+35.739 mln
23.7%
jan 1, 1976
220.127 mln
+33.569 mln
17.99%
jan 1, 1977
227.281 mln
+7.154 mln
3.25%
jan 1, 1978
254.02 mln
+26.739 mln
11.76%
jan 1, 1979
308.009 mln
+53.989 mln
21.25%
jan 1, 1980
411.578 mln
+103.569 mln
33.63%
jan 1, 1981
446.416 mln
+34.838 mln
8.46%
jan 1, 1982
388.959 mln
-57.457 mln
-12.87%
jan 1, 1983
375.896 mln
-13.063 mln
-3.36%
jan 1, 1984
327.862 mln
-48.034 mln
-12.78%
jan 1, 1985
330.071 mln
+2.209 mln
0.67%
jan 1, 1986
346.738 mln
+16.667 mln
5.05%
jan 1, 1987
482.001 mln
+135.263 mln
39.01%
jan 1, 1988
611.316 mln
+129.316 mln
26.83%
jan 1, 1989
721.426 mln
+110.11 mln
18.01%
jan 1, 1990
795.449 mln
+74.023 mln
10.26%
jan 1, 1991
1.029 bln
+233.599 mln
29.37%
jan 1, 1992
1.107 bln
+77.88 mln
7.57%
jan 1, 1993
1.21 bln
+103.085 mln
9.31%
jan 1, 1994
1.007 bln
-202.988 mln
-16.78%
jan 1, 1995
1.018 bln
+10.523 mln
1.04%
jan 1, 1996
1.179 bln
+161.19 mln
15.84%
jan 1, 1997
1.224 bln
+45.206 mln
3.84%
jan 1, 1998
1.181 bln
-43.348 mln
-3.54%
jan 1, 1999
1.212 bln
+31.335 mln
2.65%
jan 1, 2000
1.24 bln
+27.944 mln
2.31%
jan 1, 2001
1.402 bln
+161.819 mln
13.05%
jan 1, 2002
1.484 bln
+82.323 mln
5.87%
jan 1, 2003
1.717 bln
+233.468 mln
15.73%
jan 1, 2004
2.374 bln
+656.442 mln
38.22%
jan 1, 2005
2.917 bln
+542.859 mln
22.87%
jan 1, 2006
3.248 bln
+331.429 mln
11.36%
jan 1, 2007
3.537 bln
+288.417 mln
8.88%
jan 1, 2008
4.011 bln
+474.358 mln
13.41%
jan 1, 2009
4.001 bln
-9.79 mln
-0.24%
jan 1, 2010
3.65 bln
-351.118 mln
-8.78%
jan 1, 2011
3.347 bln
-303.567 mln
-8.32%
jan 1, 2012
3.427 bln
+80.506 mln
2.41%
jan 1, 2013
3.146 bln
-280.871 mln
-8.2%
jan 1, 2014
3.249 bln
+102.773 mln
3.27%
Ranking of countries by current statistics by years


Comments: