29
/
en
AIzaSyAYiBZKx7MnpbEhh9jyipgxe19OcubqV5w
April 1, 2024
102431
Central African Republic
CAF
true
2
1
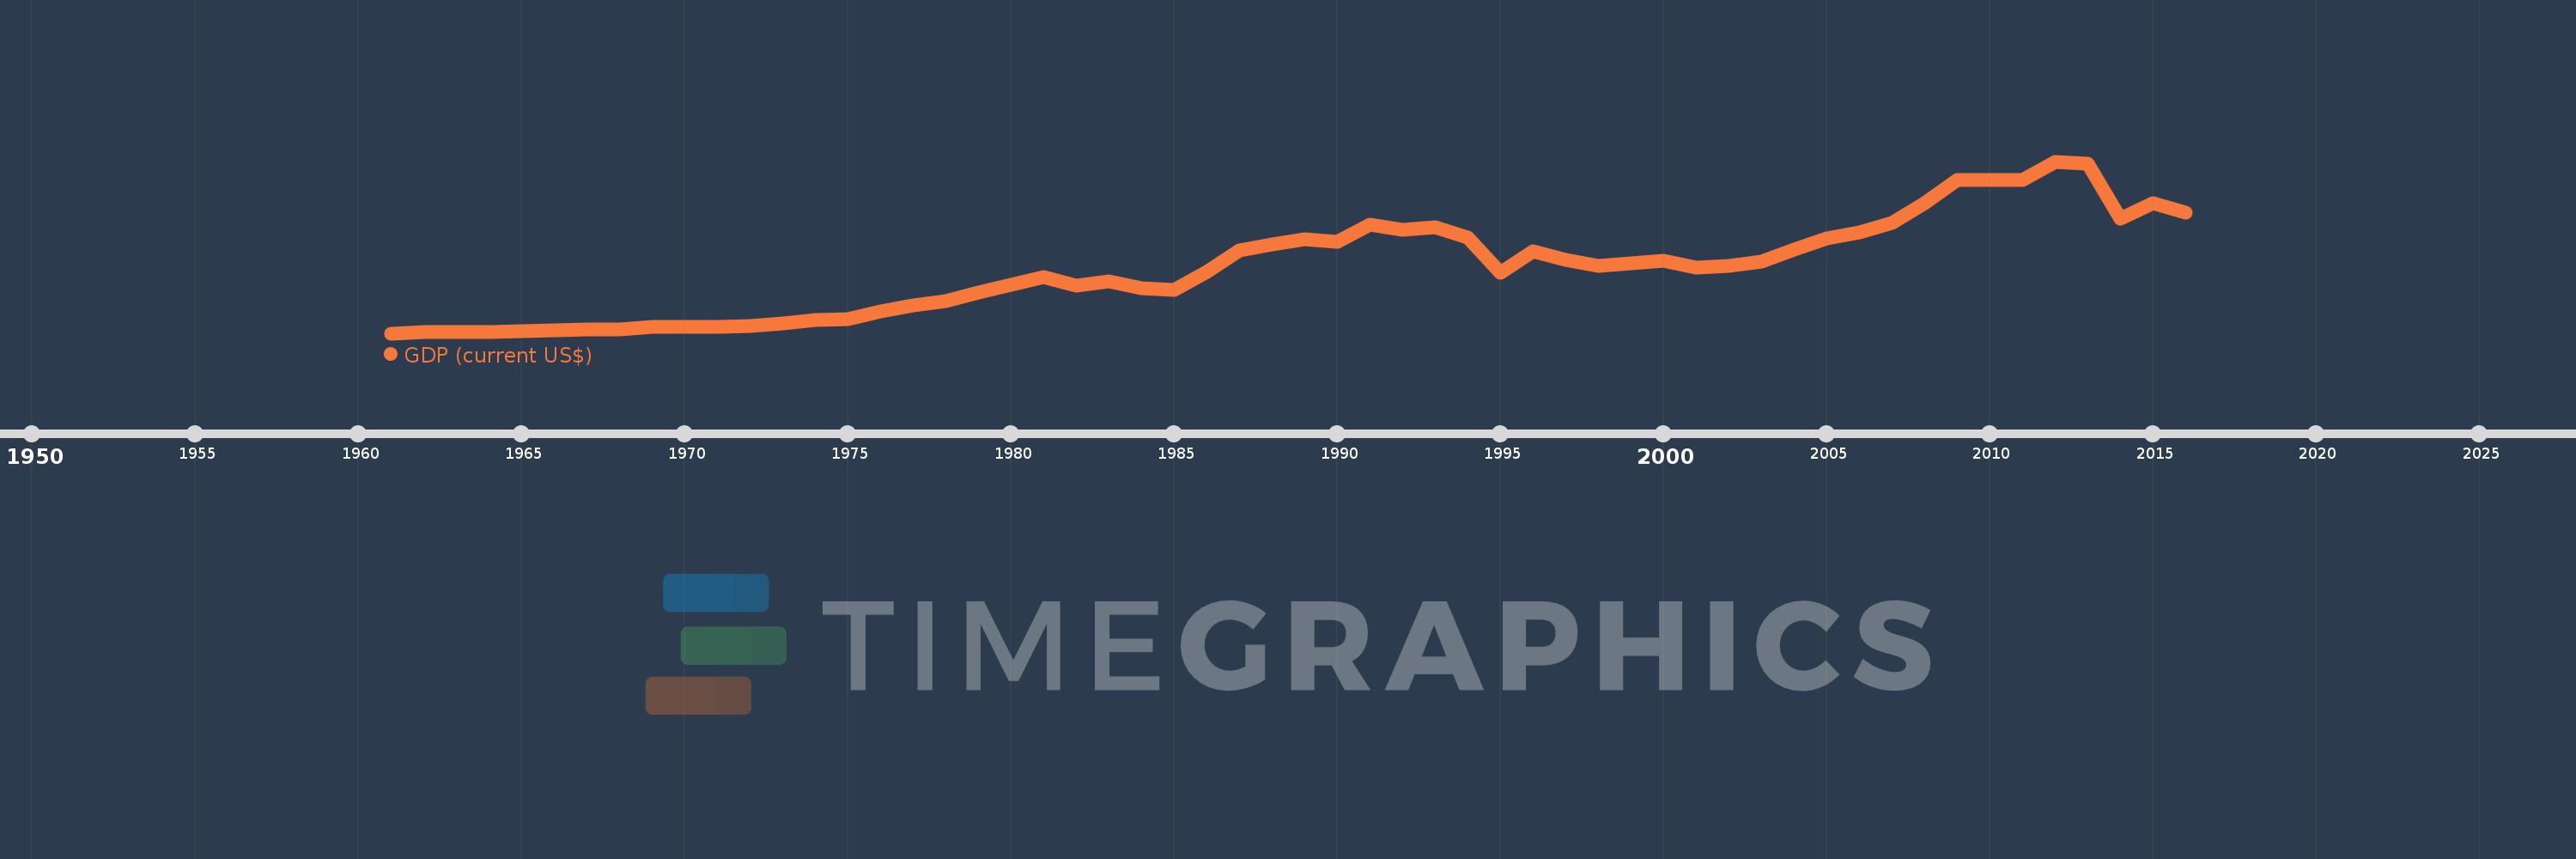
GDP (current US$)
2016,2015,2014,2013,2012,2011,2010,2009,2008,2007,2006,2005,2004,2003,2002,2001,2000,1999,1998,1997,1996,1995,1994,1993,1992,1991,1990,1989,1988,1987,1986,1985,1984,1983,1982,1981,1980,1979,1978,1977,1976,1975,1974,1973,1972,1971,1970,1969,1968,1967,1966,1965,1964,1963,1962,1961
This statistics in other country:
AfghanistanAlbaniaAlgeriaAndorraAngolaAntigua and BarbudaArab WorldArgentinaArmeniaArubaAustraliaAustriaAzerbaijanBahamas, TheBahrainBangladeshBarbadosBelarusBelgiumBelizeBeninBermudaBhutanBoliviaBosnia and HerzegovinaBotswanaBrazilBrunei DarussalamBulgariaBurkina FasoBurundiCabo VerdeCambodiaCameroonCanadaCaribbean small statesCayman IslandsCentral African RepublicCentral Europe and the BalticsChadChannel IslandsChileChinaColombiaComorosCongo, Dem. Rep.Congo, Rep.Costa RicaCote d'IvoireCroatiaCubaCyprusCzech RepublicDenmarkDjiboutiDominicaDominican RepublicEarly-demographic dividendEast Asia & PacificEast Asia & Pacific (excluding high income)East Asia & Pacific (IDA & IBRD countries)EcuadorEgypt, Arab Rep.El SalvadorEquatorial GuineaEritreaEstoniaEthiopiaEuro areaEurope & Central AsiaEurope & Central Asia (excluding high income)Europe & Central Asia (IDA & IBRD countries)European UnionFaroe IslandsFijiFinlandFragile and conflict affected situationsFranceFrench PolynesiaGabonGambia, TheGeorgiaGermanyGhanaGreeceGreenlandGrenadaGuatemalaGuineaGuinea-BissauGuyanaHaitiHeavily indebted poor countries (HIPC)High incomeHondurasHong Kong SAR, ChinaHungaryIBRD onlyIcelandIDA & IBRD totalIDA blendIDA onlyIDA totalIndiaIndonesiaIran, Islamic Rep.IraqIrelandIsle of ManIsraelItalyJamaicaJapanJordanKazakhstanKenyaKiribatiKorea, Rep.KosovoKuwaitKyrgyz RepublicLao PDRLate-demographic dividendLatin America & Caribbean Latin America & Caribbean (excluding high income)Latin America & the Caribbean (IDA & IBRD countries)LatviaLeast developed countries: UN classificationLebanonLesothoLiberiaLibyaLiechtensteinLithuaniaLow & middle incomeLow incomeLower middle incomeLuxembourgMacao SAR, ChinaMacedonia, FYRMadagascarMalawiMalaysiaMaldivesMaliMaltaMarshall IslandsMauritaniaMauritiusMexicoMicronesia, Fed. Sts.Middle East & North AfricaMiddle East & North Africa (excluding high income)Middle East & North Africa (IDA & IBRD countries)Middle incomeMoldovaMonacoMongoliaMontenegroMoroccoMozambiqueMyanmarNamibiaNauruNepalNetherlandsNew CaledoniaNew ZealandNicaraguaNigerNigeriaNorth AmericaNorwayOECD membersOmanOther small statesPacific island small statesPakistanPalauPanamaPapua New GuineaParaguayPeruPhilippinesPolandPortugalPost-demographic dividendPre-demographic dividendPuerto RicoQatarRomaniaRussian FederationRwandaSamoaSan MarinoSao Tome and PrincipeSaudi ArabiaSenegalSerbiaSeychellesSierra LeoneSingaporeSlovak RepublicSloveniaSmall statesSolomon IslandsSomaliaSouth AfricaSouth AsiaSouth Asia (IDA & IBRD)South SudanSpainSri LankaSt. Kitts and NevisSt. LuciaSt. Vincent and the GrenadinesSub-Saharan Africa Sub-Saharan Africa (excluding high income)Sub-Saharan Africa (IDA & IBRD countries)SudanSurinameSwazilandSwedenSwitzerlandSyrian Arab RepublicTajikistanTanzaniaThailandTimor-LesteTogoTongaTrinidad and TobagoTunisiaTurkeyTurkmenistanTuvaluUgandaUkraineUnited Arab EmiratesUnited KingdomUnited StatesUpper middle incomeUruguayUzbekistanVanuatuVenezuela, RBVietnamVirgin Islands (U.S.)West Bank and GazaWorldYemen, Rep.ZambiaZimbabwe Timeline:
This timeline shows a graph from 1961 to 2016 of Central African Republic. No data until 1960. Number of actual observations by date: 56.
Source name:
World Development Indicators
Source organization:
World Bank national accounts data, and OECD National Accounts data files.
Categories, topics:
Economy & Growth
Last updated:
apr 23, 2017
Indicators value changes by year
Minimum:
112.156 mln
jan 1, 1961
Maximum:
2.213 bln
jan 1, 2012
At the date of observation
Value
Absolute change
Change from previous value
jan 1, 1961
112.156 mln
+112.156 mln
0.0%
jan 1, 1962
123.135 mln
+10.979 mln
9.79%
jan 1, 1963
124.483 mln
+1.348 mln
1.09%
jan 1, 1964
129.379 mln
+4.896 mln
3.93%
jan 1, 1965
142.025 mln
+12.646 mln
9.77%
jan 1, 1966
150.575 mln
+8.55 mln
6.02%
jan 1, 1967
157.93 mln
+7.355 mln
4.88%
jan 1, 1968
163.821 mln
+5.89 mln
3.73%
jan 1, 1969
191.767 mln
+27.947 mln
17.06%
jan 1, 1970
188.039 mln
-3.728 mln
-1.94%
jan 1, 1971
189.107 mln
+1.067 mln
0.57%
jan 1, 1972
201.451 mln
+12.344 mln
6.53%
jan 1, 1973
230.318 mln
+28.867 mln
14.33%
jan 1, 1974
271.183 mln
+40.865 mln
17.74%
jan 1, 1975
281.399 mln
+10.216 mln
3.77%
jan 1, 1976
378.66 mln
+97.261 mln
34.56%
jan 1, 1977
451.152 mln
+72.492 mln
19.14%
jan 1, 1978
507.298 mln
+56.146 mln
12.44%
jan 1, 1979
610.579 mln
+103.28 mln
20.36%
jan 1, 1980
700.765 mln
+90.186 mln
14.77%
jan 1, 1981
797.048 mln
+96.283 mln
13.74%
jan 1, 1982
694.804 mln
-102.245 mln
-12.83%
jan 1, 1983
748.312 mln
+53.509 mln
7.7%
jan 1, 1984
658.679 mln
-89.633 mln
-11.98%
jan 1, 1985
637.821 mln
-20.859 mln
-3.17%
jan 1, 1986
864.85 mln
+227.029 mln
35.59%
jan 1, 1987
1.122 bln
+257.415 mln
29.76%
jan 1, 1988
1.201 bln
+78.727 mln
7.01%
jan 1, 1989
1.265 bln
+63.908 mln
5.32%
jan 1, 1990
1.234 bln
-30.969 mln
-2.45%
jan 1, 1991
1.441 bln
+206.781 mln
16.76%
jan 1, 1992
1.377 bln
-63.336 mln
-4.4%
jan 1, 1993
1.412 bln
+34.543 mln
2.51%
jan 1, 1994
1.279 bln
-133.136 mln
-9.43%
jan 1, 1995
851.174 mln
-427.607 mln
-33.44%
jan 1, 1996
1.115 bln
+264.215 mln
31.04%
jan 1, 1997
1.008 bln
-107.599 mln
-9.65%
jan 1, 1998
937.741 mln
-70.05 mln
-6.95%
jan 1, 1999
967.338 mln
+29.597 mln
3.16%
jan 1, 2000
999.478 mln
+32.139 mln
3.32%
jan 1, 2001
914.5 mln
-84.977 mln
-8.5%
jan 1, 2002
931.833 mln
+17.333 mln
1.9%
jan 1, 2003
991.388 mln
+59.555 mln
6.39%
jan 1, 2004
1.14 bln
+148.367 mln
14.97%
jan 1, 2005
1.27 bln
+130.325 mln
11.43%
jan 1, 2006
1.35 bln
+80.221 mln
6.32%
jan 1, 2007
1.461 bln
+110.261 mln
8.17%
jan 1, 2008
1.698 bln
+237.564 mln
16.27%
jan 1, 2009
1.985 bln
+287.244 mln
16.92%
jan 1, 2010
1.982 bln
-3.642 mln
-0.18%
jan 1, 2011
1.986 bln
+4.287 mln
0.22%
jan 1, 2012
2.213 bln
+226.685 mln
11.41%
jan 1, 2013
2.184 bln
-28.516 mln
-1.29%
jan 1, 2014
1.519 bln
-665.619 mln
-30.47%
jan 1, 2015
1.703 bln
+184.334 mln
12.14%
jan 1, 2016
1.584 bln
-119.122 mln
-7.0%
Ranking of countries by current statistics by years


Comments: