29
/
en
AIzaSyAYiBZKx7MnpbEhh9jyipgxe19OcubqV5w
April 1, 2024
130453
Ethiopia
ETH
true
2
1
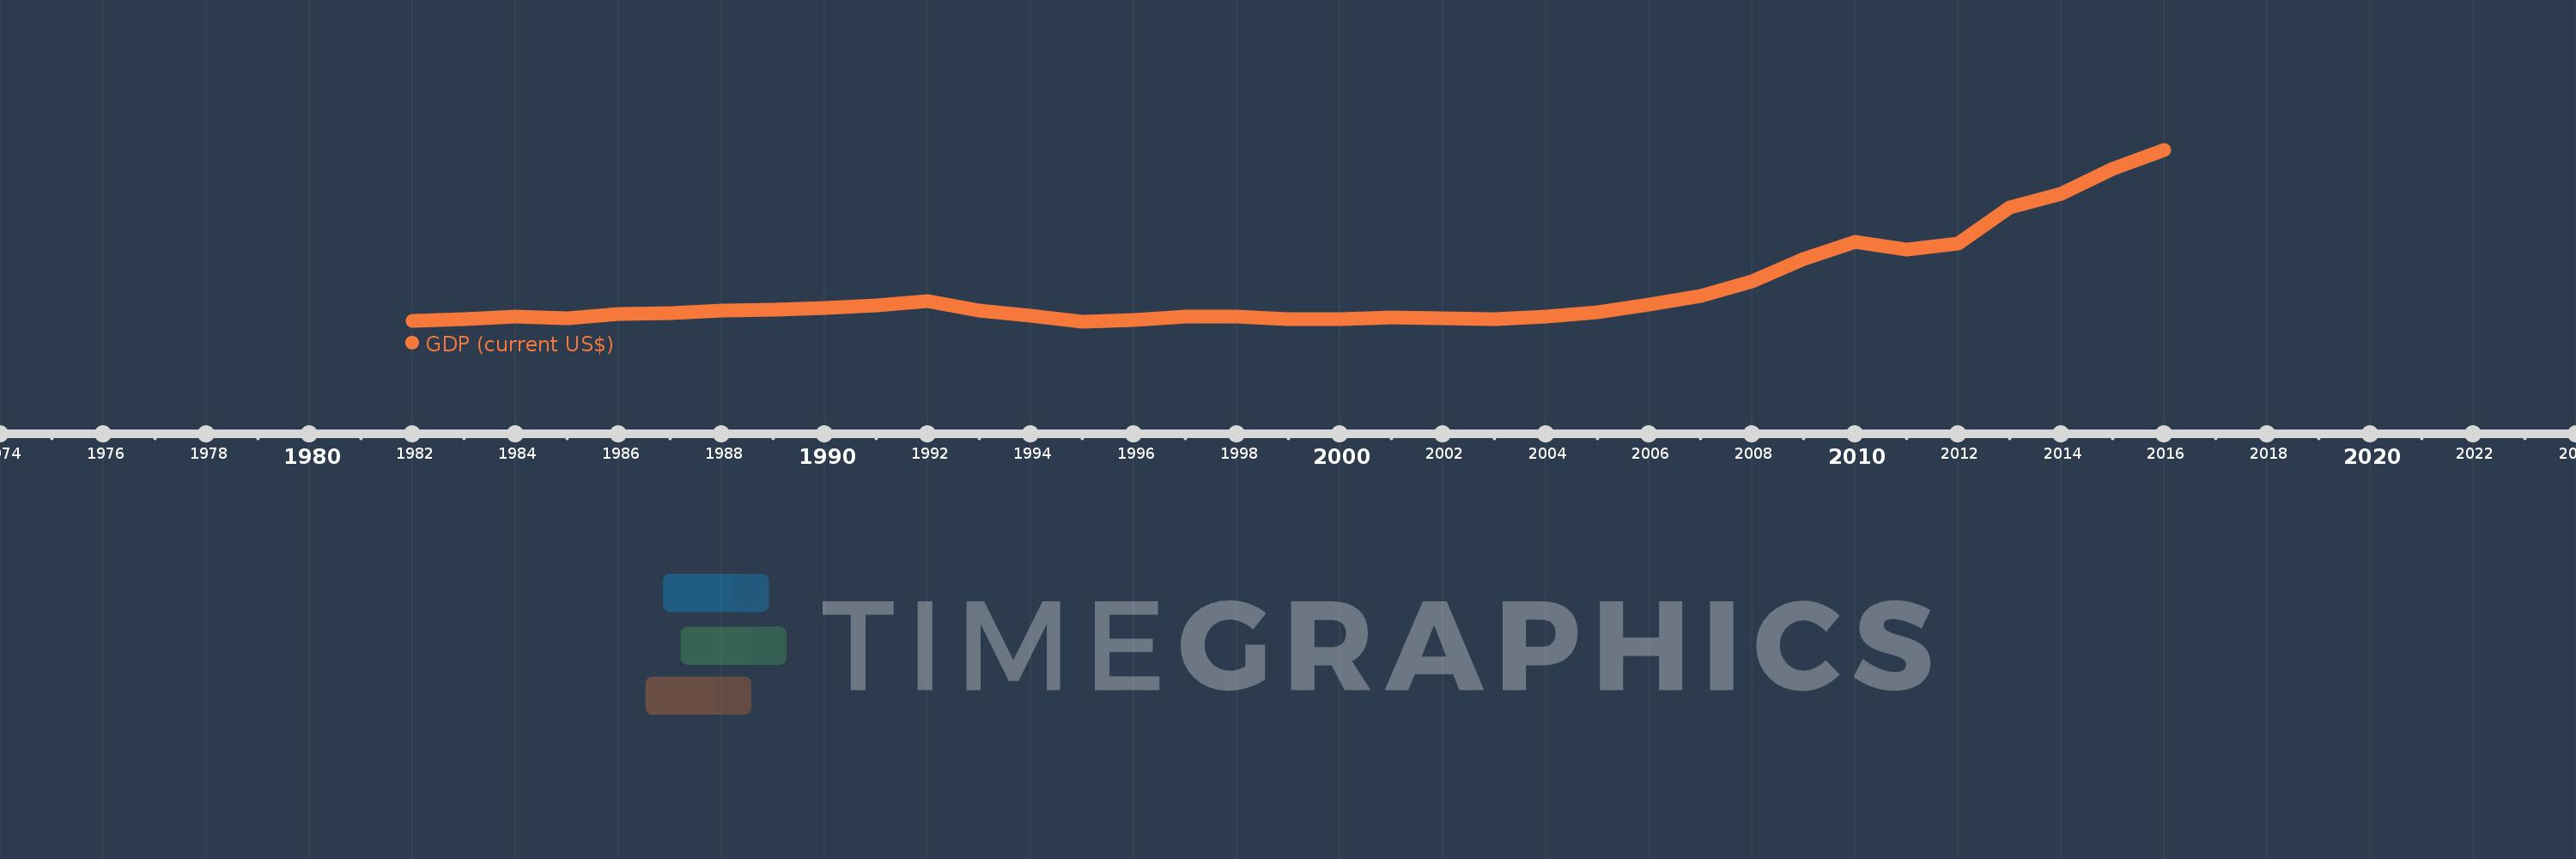
GDP (current US$)
2016,2015,2014,2013,2012,2011,2010,2009,2008,2007,2006,2005,2004,2003,2002,2001,2000,1999,1998,1997,1996,1995,1994,1993,1992,1991,1990,1989,1988,1987,1986,1985,1984,1983,1982
This statistics in other country:
AfghanistanAlbaniaAlgeriaAndorraAngolaAntigua and BarbudaArab WorldArgentinaArmeniaArubaAustraliaAustriaAzerbaijanBahamas, TheBahrainBangladeshBarbadosBelarusBelgiumBelizeBeninBermudaBhutanBoliviaBosnia and HerzegovinaBotswanaBrazilBrunei DarussalamBulgariaBurkina FasoBurundiCabo VerdeCambodiaCameroonCanadaCaribbean small statesCayman IslandsCentral African RepublicCentral Europe and the BalticsChadChannel IslandsChileChinaColombiaComorosCongo, Dem. Rep.Congo, Rep.Costa RicaCote d'IvoireCroatiaCubaCyprusCzech RepublicDenmarkDjiboutiDominicaDominican RepublicEarly-demographic dividendEast Asia & PacificEast Asia & Pacific (excluding high income)East Asia & Pacific (IDA & IBRD countries)EcuadorEgypt, Arab Rep.El SalvadorEquatorial GuineaEritreaEstoniaEthiopiaEuro areaEurope & Central AsiaEurope & Central Asia (excluding high income)Europe & Central Asia (IDA & IBRD countries)European UnionFaroe IslandsFijiFinlandFragile and conflict affected situationsFranceFrench PolynesiaGabonGambia, TheGeorgiaGermanyGhanaGreeceGreenlandGrenadaGuatemalaGuineaGuinea-BissauGuyanaHaitiHeavily indebted poor countries (HIPC)High incomeHondurasHong Kong SAR, ChinaHungaryIBRD onlyIcelandIDA & IBRD totalIDA blendIDA onlyIDA totalIndiaIndonesiaIran, Islamic Rep.IraqIrelandIsle of ManIsraelItalyJamaicaJapanJordanKazakhstanKenyaKiribatiKorea, Rep.KosovoKuwaitKyrgyz RepublicLao PDRLate-demographic dividendLatin America & Caribbean Latin America & Caribbean (excluding high income)Latin America & the Caribbean (IDA & IBRD countries)LatviaLeast developed countries: UN classificationLebanonLesothoLiberiaLibyaLiechtensteinLithuaniaLow & middle incomeLow incomeLower middle incomeLuxembourgMacao SAR, ChinaMacedonia, FYRMadagascarMalawiMalaysiaMaldivesMaliMaltaMarshall IslandsMauritaniaMauritiusMexicoMicronesia, Fed. Sts.Middle East & North AfricaMiddle East & North Africa (excluding high income)Middle East & North Africa (IDA & IBRD countries)Middle incomeMoldovaMonacoMongoliaMontenegroMoroccoMozambiqueMyanmarNamibiaNauruNepalNetherlandsNew CaledoniaNew ZealandNicaraguaNigerNigeriaNorth AmericaNorwayOECD membersOmanOther small statesPacific island small statesPakistanPalauPanamaPapua New GuineaParaguayPeruPhilippinesPolandPortugalPost-demographic dividendPre-demographic dividendPuerto RicoQatarRomaniaRussian FederationRwandaSamoaSan MarinoSao Tome and PrincipeSaudi ArabiaSenegalSerbiaSeychellesSierra LeoneSingaporeSlovak RepublicSloveniaSmall statesSolomon IslandsSomaliaSouth AfricaSouth AsiaSouth Asia (IDA & IBRD)South SudanSpainSri LankaSt. Kitts and NevisSt. LuciaSt. Vincent and the GrenadinesSub-Saharan Africa Sub-Saharan Africa (excluding high income)Sub-Saharan Africa (IDA & IBRD countries)SudanSurinameSwazilandSwedenSwitzerlandSyrian Arab RepublicTajikistanTanzaniaThailandTimor-LesteTogoTongaTrinidad and TobagoTunisiaTurkeyTurkmenistanTuvaluUgandaUkraineUnited Arab EmiratesUnited KingdomUnited StatesUpper middle incomeUruguayUzbekistanVanuatuVenezuela, RBVietnamVirgin Islands (U.S.)West Bank and GazaWorldYemen, Rep.ZambiaZimbabwe Timeline:
This timeline shows a graph from 1982 to 2016 of Ethiopia. No data until 1981. Number of actual observations by date: 35.
Source name:
World Development Indicators
Source organization:
World Bank national accounts data, and OECD National Accounts data files.
Categories, topics:
Economy & Growth
Last updated:
apr 23, 2017
Indicators value changes by year
Minimum:
6.928 bln
jan 1, 1995
Maximum:
61.54 bln
jan 1, 2016
At the date of observation
Value
Absolute change
Change from previous value
jan 1, 1982
7.325 bln
+7.325 bln
0.0%
jan 1, 1983
7.708 bln
+382.775 mln
5.23%
jan 1, 1984
8.568 bln
+860.213 mln
11.16%
jan 1, 1985
8.096 bln
-471.588 mln
-5.5%
jan 1, 1986
9.481 bln
+1.385 bln
17.1%
jan 1, 1987
9.849 bln
+367.76 mln
3.88%
jan 1, 1988
10.527 bln
+678.738 mln
6.89%
jan 1, 1989
10.909 bln
+381.597 mln
3.62%
jan 1, 1990
11.477 bln
+567.649 mln
5.2%
jan 1, 1991
12.175 bln
+698.582 mln
6.09%
jan 1, 1992
13.464 bln
+1.289 bln
10.58%
jan 1, 1993
10.493 bln
-2.971 bln
-22.07%
jan 1, 1994
8.831 bln
-1.662 bln
-15.84%
jan 1, 1995
6.928 bln
-1.903 bln
-21.55%
jan 1, 1996
7.664 bln
+736.034 mln
10.62%
jan 1, 1997
8.548 bln
+883.955 mln
11.53%
jan 1, 1998
8.589 bln
+41.272 mln
0.48%
jan 1, 1999
7.818 bln
-770.986 mln
-8.98%
jan 1, 2000
7.701 bln
-117.391 mln
-1.5%
jan 1, 2001
8.242 bln
+541.559 mln
7.03%
jan 1, 2002
8.231 bln
-11.066 mln
-0.13%
jan 1, 2003
7.851 bln
-380.517 mln
-4.62%
jan 1, 2004
8.624 bln
+772.882 mln
9.84%
jan 1, 2005
10.131 bln
+1.507 bln
17.48%
jan 1, 2006
12.401 bln
+2.27 bln
22.41%
jan 1, 2007
15.281 bln
+2.88 bln
23.22%
jan 1, 2008
19.708 bln
+4.427 bln
28.97%
jan 1, 2009
27.067 bln
+7.359 bln
37.34%
jan 1, 2010
32.437 bln
+5.37 bln
19.84%
jan 1, 2011
29.934 bln
-2.504 bln
-7.72%
jan 1, 2012
31.953 bln
+2.019 bln
6.74%
jan 1, 2013
43.311 bln
+11.358 bln
35.55%
jan 1, 2014
47.648 bln
+4.337 bln
10.01%
jan 1, 2015
55.612 bln
+7.964 bln
16.71%
jan 1, 2016
61.54 bln
+5.927 bln
10.66%
Ranking of countries by current statistics by years


Comments: