29
/
en
AIzaSyAYiBZKx7MnpbEhh9jyipgxe19OcubqV5w
April 1, 2024
279778
Vanuatu
VUT
true
2
1
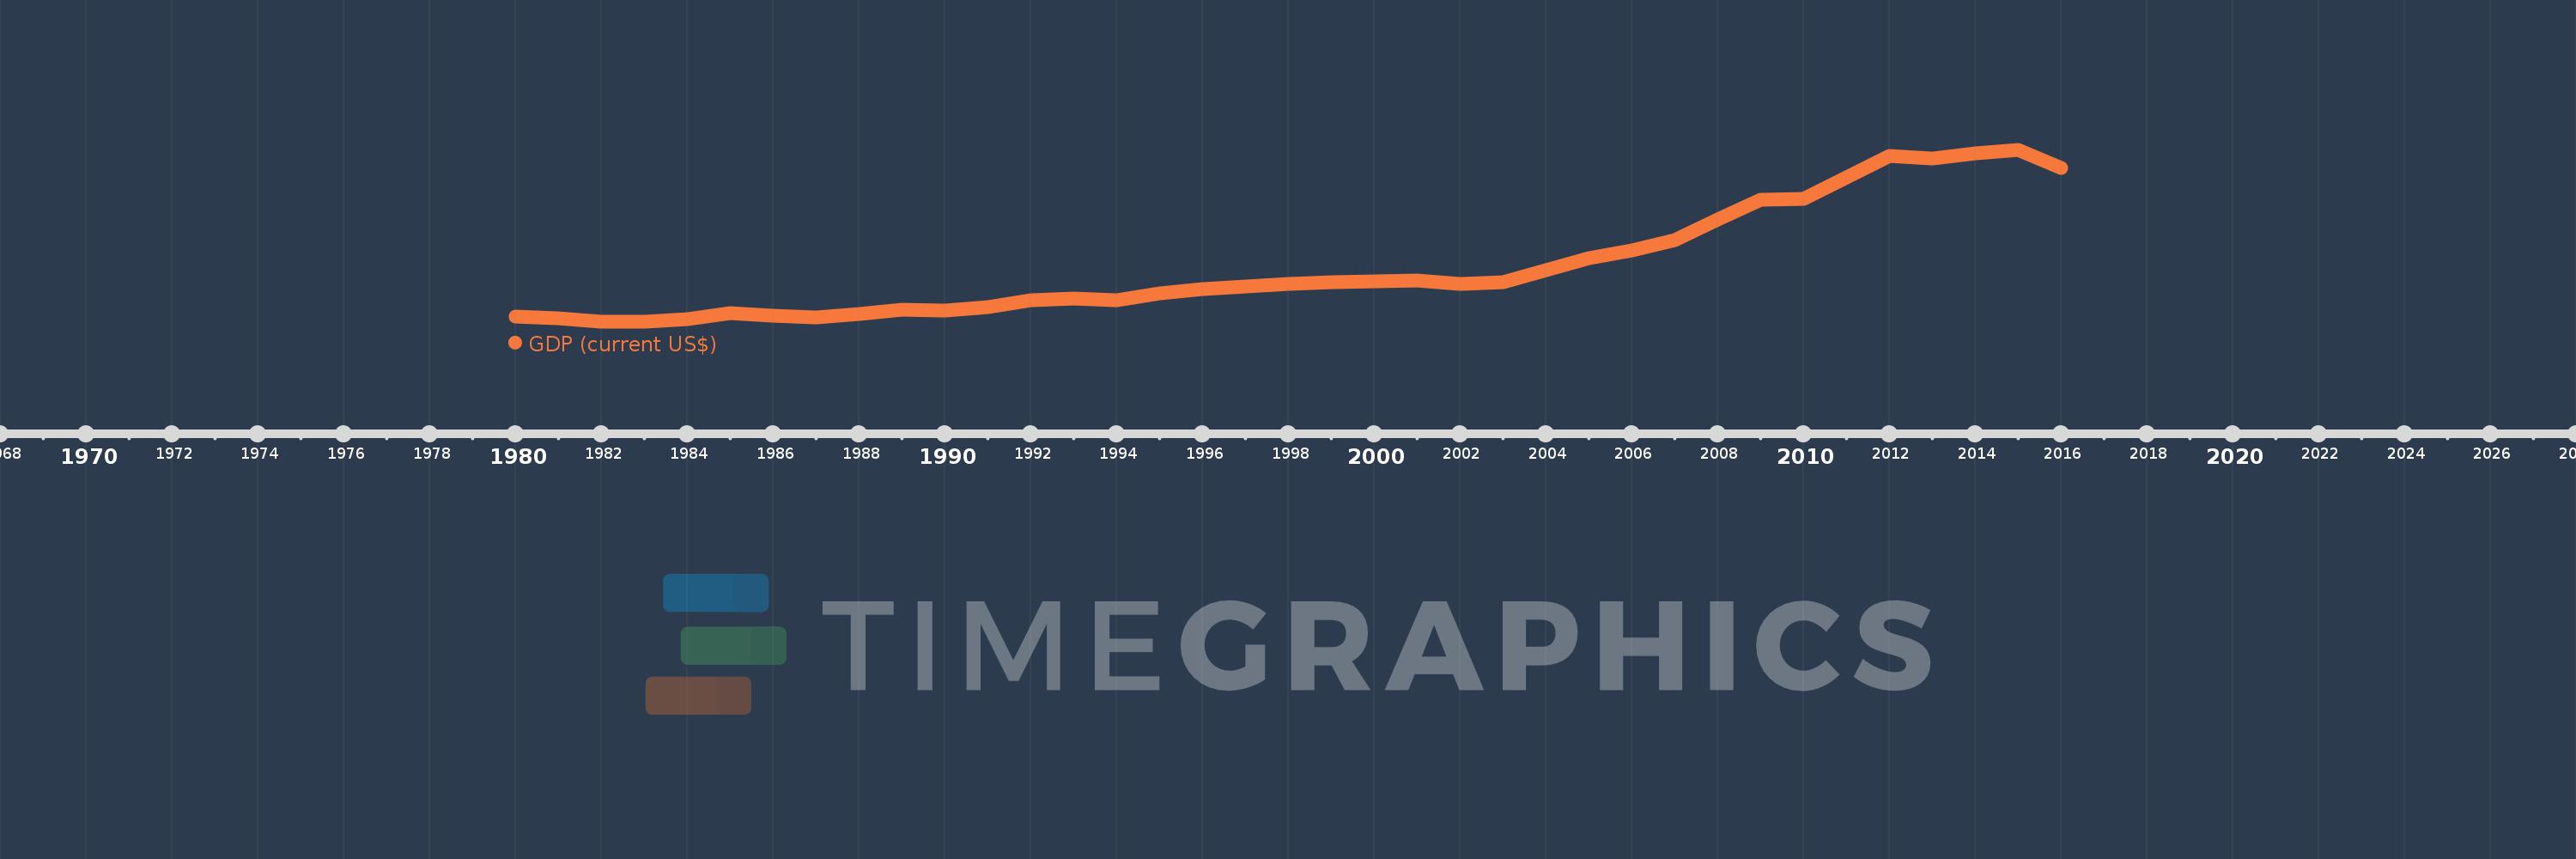
GDP (current US$)
2016,2015,2014,2013,2012,2011,2010,2009,2008,2007,2006,2005,2004,2003,2002,2001,2000,1999,1998,1997,1996,1995,1994,1993,1992,1991,1990,1989,1988,1987,1986,1985,1984,1983,1982,1981,1980
This statistics in other country:
AfghanistanAlbaniaAlgeriaAndorraAngolaAntigua and BarbudaArab WorldArgentinaArmeniaArubaAustraliaAustriaAzerbaijanBahamas, TheBahrainBangladeshBarbadosBelarusBelgiumBelizeBeninBermudaBhutanBoliviaBosnia and HerzegovinaBotswanaBrazilBrunei DarussalamBulgariaBurkina FasoBurundiCabo VerdeCambodiaCameroonCanadaCaribbean small statesCayman IslandsCentral African RepublicCentral Europe and the BalticsChadChannel IslandsChileChinaColombiaComorosCongo, Dem. Rep.Congo, Rep.Costa RicaCote d'IvoireCroatiaCubaCyprusCzech RepublicDenmarkDjiboutiDominicaDominican RepublicEarly-demographic dividendEast Asia & PacificEast Asia & Pacific (excluding high income)East Asia & Pacific (IDA & IBRD countries)EcuadorEgypt, Arab Rep.El SalvadorEquatorial GuineaEritreaEstoniaEthiopiaEuro areaEurope & Central AsiaEurope & Central Asia (excluding high income)Europe & Central Asia (IDA & IBRD countries)European UnionFaroe IslandsFijiFinlandFragile and conflict affected situationsFranceFrench PolynesiaGabonGambia, TheGeorgiaGermanyGhanaGreeceGreenlandGrenadaGuatemalaGuineaGuinea-BissauGuyanaHaitiHeavily indebted poor countries (HIPC)High incomeHondurasHong Kong SAR, ChinaHungaryIBRD onlyIcelandIDA & IBRD totalIDA blendIDA onlyIDA totalIndiaIndonesiaIran, Islamic Rep.IraqIrelandIsle of ManIsraelItalyJamaicaJapanJordanKazakhstanKenyaKiribatiKorea, Rep.KosovoKuwaitKyrgyz RepublicLao PDRLate-demographic dividendLatin America & Caribbean Latin America & Caribbean (excluding high income)Latin America & the Caribbean (IDA & IBRD countries)LatviaLeast developed countries: UN classificationLebanonLesothoLiberiaLibyaLiechtensteinLithuaniaLow & middle incomeLow incomeLower middle incomeLuxembourgMacao SAR, ChinaMacedonia, FYRMadagascarMalawiMalaysiaMaldivesMaliMaltaMarshall IslandsMauritaniaMauritiusMexicoMicronesia, Fed. Sts.Middle East & North AfricaMiddle East & North Africa (excluding high income)Middle East & North Africa (IDA & IBRD countries)Middle incomeMoldovaMonacoMongoliaMontenegroMoroccoMozambiqueMyanmarNamibiaNauruNepalNetherlandsNew CaledoniaNew ZealandNicaraguaNigerNigeriaNorth AmericaNorwayOECD membersOmanOther small statesPacific island small statesPakistanPalauPanamaPapua New GuineaParaguayPeruPhilippinesPolandPortugalPost-demographic dividendPre-demographic dividendPuerto RicoQatarRomaniaRussian FederationRwandaSamoaSan MarinoSao Tome and PrincipeSaudi ArabiaSenegalSerbiaSeychellesSierra LeoneSingaporeSlovak RepublicSloveniaSmall statesSolomon IslandsSomaliaSouth AfricaSouth AsiaSouth Asia (IDA & IBRD)South SudanSpainSri LankaSt. Kitts and NevisSt. LuciaSt. Vincent and the GrenadinesSub-Saharan Africa Sub-Saharan Africa (excluding high income)Sub-Saharan Africa (IDA & IBRD countries)SudanSurinameSwazilandSwedenSwitzerlandSyrian Arab RepublicTajikistanTanzaniaThailandTimor-LesteTogoTongaTrinidad and TobagoTunisiaTurkeyTurkmenistanTuvaluUgandaUkraineUnited Arab EmiratesUnited KingdomUnited StatesUpper middle incomeUruguayUzbekistanVanuatuVenezuela, RBVietnamVirgin Islands (U.S.)West Bank and GazaWorldYemen, Rep.ZambiaZimbabwe Timeline:
This timeline shows a graph from 1980 to 2016 of Vanuatu. No data until 1979. Number of actual observations by date: 37.
Source name:
World Development Indicators
Source organization:
World Bank national accounts data, and OECD National Accounts data files.
Categories, topics:
Economy & Growth
Last updated:
apr 23, 2017
Indicators value changes by year
Minimum:
98.145 mln
jan 1, 1983
Maximum:
814.954 mln
jan 1, 2015
At the date of observation
Value
Absolute change
Change from previous value
jan 1, 1980
119.259 mln
+119.259 mln
0.0%
jan 1, 1981
113.423 mln
-5.836 mln
-4.89%
jan 1, 1982
98.746 mln
-14.677 mln
-12.94%
jan 1, 1983
98.145 mln
-601.761K
-0.61%
jan 1, 1984
110.124 mln
+11.979 mln
12.21%
jan 1, 1985
135.554 mln
+25.43 mln
23.09%
jan 1, 1986
123.699 mln
-11.855 mln
-8.75%
jan 1, 1987
118.691 mln
-5.007 mln
-4.05%
jan 1, 1988
130.834 mln
+12.143 mln
10.23%
jan 1, 1989
148.545 mln
+17.711 mln
13.54%
jan 1, 1990
144.482 mln
-4.063 mln
-2.74%
jan 1, 1991
158.397 mln
+13.915 mln
9.63%
jan 1, 1992
188.87 mln
+30.473 mln
19.24%
jan 1, 1993
196.143 mln
+7.273 mln
3.85%
jan 1, 1994
188.08 mln
-8.062 mln
-4.11%
jan 1, 1995
219.26 mln
+31.18 mln
16.58%
jan 1, 1996
233.902 mln
+14.642 mln
6.68%
jan 1, 1997
245.178 mln
+11.276 mln
4.82%
jan 1, 1998
255.89 mln
+10.713 mln
4.37%
jan 1, 1999
262.301 mln
+6.411 mln
2.51%
jan 1, 2000
267.999 mln
+5.698 mln
2.17%
jan 1, 2001
272.015 mln
+4.015 mln
1.5%
jan 1, 2002
257.927 mln
-14.088 mln
-5.18%
jan 1, 2003
262.604 mln
+4.677 mln
1.81%
jan 1, 2004
314.463 mln
+51.859 mln
19.75%
jan 1, 2005
364.997 mln
+50.534 mln
16.07%
jan 1, 2006
394.963 mln
+29.966 mln
8.21%
jan 1, 2007
439.377 mln
+44.414 mln
11.25%
jan 1, 2008
526.428 mln
+87.052 mln
19.81%
jan 1, 2009
607.959 mln
+81.53 mln
15.49%
jan 1, 2010
610.067 mln
+2.108 mln
0.35%
jan 1, 2011
700.804 mln
+90.738 mln
14.87%
jan 1, 2012
792.15 mln
+91.345 mln
13.03%
jan 1, 2013
781.703 mln
-10.447 mln
-1.32%
jan 1, 2014
801.788 mln
+20.085 mln
2.57%
jan 1, 2015
814.954 mln
+13.167 mln
1.64%
jan 1, 2016
742.432 mln
-72.522 mln
-8.9%
Ranking of countries by current statistics by years


Comments: