29
/
en
AIzaSyAYiBZKx7MnpbEhh9jyipgxe19OcubqV5w
April 1, 2024
79444
Barbados
BRB
true
2
1
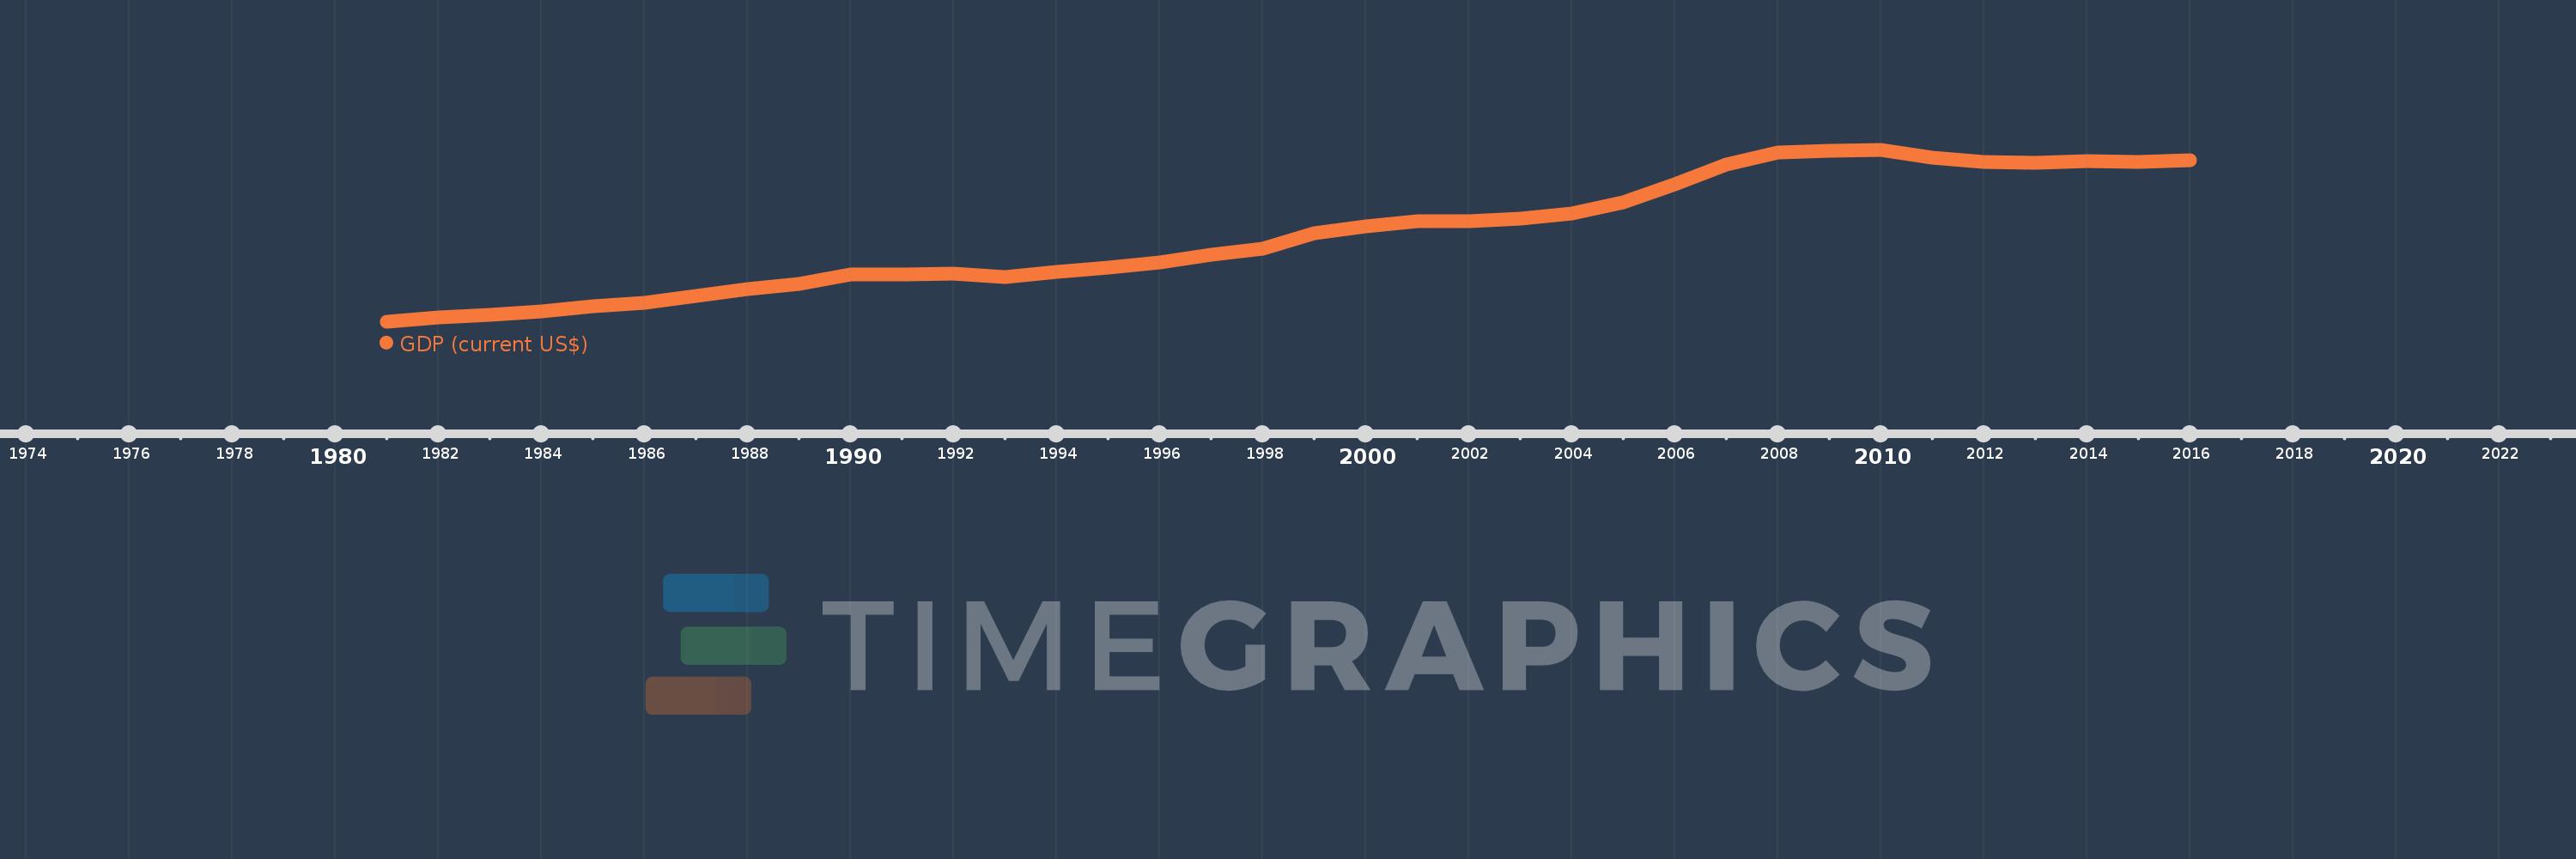
GDP (current US$)
2016,2015,2014,2013,2012,2011,2010,2009,2008,2007,2006,2005,2004,2003,2002,2001,2000,1999,1998,1997,1996,1995,1994,1993,1992,1991,1990,1989,1988,1987,1986,1985,1984,1983,1982,1981
This statistics in other country:
AfghanistanAlbaniaAlgeriaAndorraAngolaAntigua and BarbudaArab WorldArgentinaArmeniaArubaAustraliaAustriaAzerbaijanBahamas, TheBahrainBangladeshBarbadosBelarusBelgiumBelizeBeninBermudaBhutanBoliviaBosnia and HerzegovinaBotswanaBrazilBrunei DarussalamBulgariaBurkina FasoBurundiCabo VerdeCambodiaCameroonCanadaCaribbean small statesCayman IslandsCentral African RepublicCentral Europe and the BalticsChadChannel IslandsChileChinaColombiaComorosCongo, Dem. Rep.Congo, Rep.Costa RicaCote d'IvoireCroatiaCubaCyprusCzech RepublicDenmarkDjiboutiDominicaDominican RepublicEarly-demographic dividendEast Asia & PacificEast Asia & Pacific (excluding high income)East Asia & Pacific (IDA & IBRD countries)EcuadorEgypt, Arab Rep.El SalvadorEquatorial GuineaEritreaEstoniaEthiopiaEuro areaEurope & Central AsiaEurope & Central Asia (excluding high income)Europe & Central Asia (IDA & IBRD countries)European UnionFaroe IslandsFijiFinlandFragile and conflict affected situationsFranceFrench PolynesiaGabonGambia, TheGeorgiaGermanyGhanaGreeceGreenlandGrenadaGuatemalaGuineaGuinea-BissauGuyanaHaitiHeavily indebted poor countries (HIPC)High incomeHondurasHong Kong SAR, ChinaHungaryIBRD onlyIcelandIDA & IBRD totalIDA blendIDA onlyIDA totalIndiaIndonesiaIran, Islamic Rep.IraqIrelandIsle of ManIsraelItalyJamaicaJapanJordanKazakhstanKenyaKiribatiKorea, Rep.KosovoKuwaitKyrgyz RepublicLao PDRLate-demographic dividendLatin America & Caribbean Latin America & Caribbean (excluding high income)Latin America & the Caribbean (IDA & IBRD countries)LatviaLeast developed countries: UN classificationLebanonLesothoLiberiaLibyaLiechtensteinLithuaniaLow & middle incomeLow incomeLower middle incomeLuxembourgMacao SAR, ChinaMacedonia, FYRMadagascarMalawiMalaysiaMaldivesMaliMaltaMarshall IslandsMauritaniaMauritiusMexicoMicronesia, Fed. Sts.Middle East & North AfricaMiddle East & North Africa (excluding high income)Middle East & North Africa (IDA & IBRD countries)Middle incomeMoldovaMonacoMongoliaMontenegroMoroccoMozambiqueMyanmarNamibiaNauruNepalNetherlandsNew CaledoniaNew ZealandNicaraguaNigerNigeriaNorth AmericaNorwayOECD membersOmanOther small statesPacific island small statesPakistanPalauPanamaPapua New GuineaParaguayPeruPhilippinesPolandPortugalPost-demographic dividendPre-demographic dividendPuerto RicoQatarRomaniaRussian FederationRwandaSamoaSan MarinoSao Tome and PrincipeSaudi ArabiaSenegalSerbiaSeychellesSierra LeoneSingaporeSlovak RepublicSloveniaSmall statesSolomon IslandsSomaliaSouth AfricaSouth AsiaSouth Asia (IDA & IBRD)South SudanSpainSri LankaSt. Kitts and NevisSt. LuciaSt. Vincent and the GrenadinesSub-Saharan Africa Sub-Saharan Africa (excluding high income)Sub-Saharan Africa (IDA & IBRD countries)SudanSurinameSwazilandSwedenSwitzerlandSyrian Arab RepublicTajikistanTanzaniaThailandTimor-LesteTogoTongaTrinidad and TobagoTunisiaTurkeyTurkmenistanTuvaluUgandaUkraineUnited Arab EmiratesUnited KingdomUnited StatesUpper middle incomeUruguayUzbekistanVanuatuVenezuela, RBVietnamVirgin Islands (U.S.)West Bank and GazaWorldYemen, Rep.ZambiaZimbabwe Timeline:
This timeline shows a graph from 1981 to 2016 of Barbados. No data until 1980. Number of actual observations by date: 36.
Source name:
World Development Indicators
Source organization:
World Bank national accounts data, and OECD National Accounts data files.
Categories, topics:
Economy & Growth
Last updated:
apr 23, 2017
Indicators value changes by year
Minimum:
1.012 bln
jan 1, 1981
Maximum:
4.601 bln
jan 1, 2010
At the date of observation
Value
Absolute change
Change from previous value
jan 1, 1981
1.012 bln
+1.012 bln
0.0%
jan 1, 1982
1.114 bln
+101.841 mln
10.06%
jan 1, 1983
1.164 bln
+49.955 mln
4.48%
jan 1, 1984
1.236 bln
+71.715 mln
6.16%
jan 1, 1985
1.347 bln
+111.258 mln
9.0%
jan 1, 1986
1.41 bln
+62.707 mln
4.66%
jan 1, 1987
1.548 bln
+138.049 mln
9.79%
jan 1, 1988
1.704 bln
+156.651 mln
10.12%
jan 1, 1989
1.813 bln
+108.451 mln
6.36%
jan 1, 1990
2.006 bln
+193.503 mln
10.67%
jan 1, 1991
2.012 bln
+5.908 mln
0.29%
jan 1, 1992
2.021 bln
+8.442 mln
0.42%
jan 1, 1993
1.957 bln
-63.576 mln
-3.15%
jan 1, 1994
2.063 bln
+106.1 mln
5.42%
jan 1, 1995
2.151 bln
+88.017 mln
4.27%
jan 1, 1996
2.262 bln
+110.712 mln
5.15%
jan 1, 1997
2.412 bln
+149.849 mln
6.62%
jan 1, 1998
2.549 bln
+137.414 mln
5.7%
jan 1, 1999
2.874 bln
+325.153 mln
12.75%
jan 1, 2000
3.012 bln
+137.609 mln
4.79%
jan 1, 2001
3.122 bln
+109.598 mln
3.64%
jan 1, 2002
3.117 bln
-4.987 mln
-0.16%
jan 1, 2003
3.17 bln
+52.98 mln
1.7%
jan 1, 2004
3.275 bln
+105.244 mln
3.32%
jan 1, 2005
3.514 bln
+239.514 mln
7.31%
jan 1, 2006
3.897 bln
+383.097 mln
10.9%
jan 1, 2007
4.303 bln
+405.808 mln
10.41%
jan 1, 2008
4.546 bln
+242.84 mln
5.64%
jan 1, 2009
4.595 bln
+49.149 mln
1.08%
jan 1, 2010
4.601 bln
+5.936 mln
0.13%
jan 1, 2011
4.447 bln
-154.371 mln
-3.36%
jan 1, 2012
4.359 bln
-87.91 mln
-1.98%
jan 1, 2013
4.332 bln
-26.779 mln
-0.61%
jan 1, 2014
4.371 bln
+39.056 mln
0.9%
jan 1, 2015
4.353 bln
-18.462 mln
-0.42%
jan 1, 2016
4.385 bln
+32.516 mln
0.75%
Ranking of countries by current statistics by years


Comments: