29
/
en
AIzaSyAYiBZKx7MnpbEhh9jyipgxe19OcubqV5w
April 1, 2024
193020
Mauritania
MRT
true
2
1
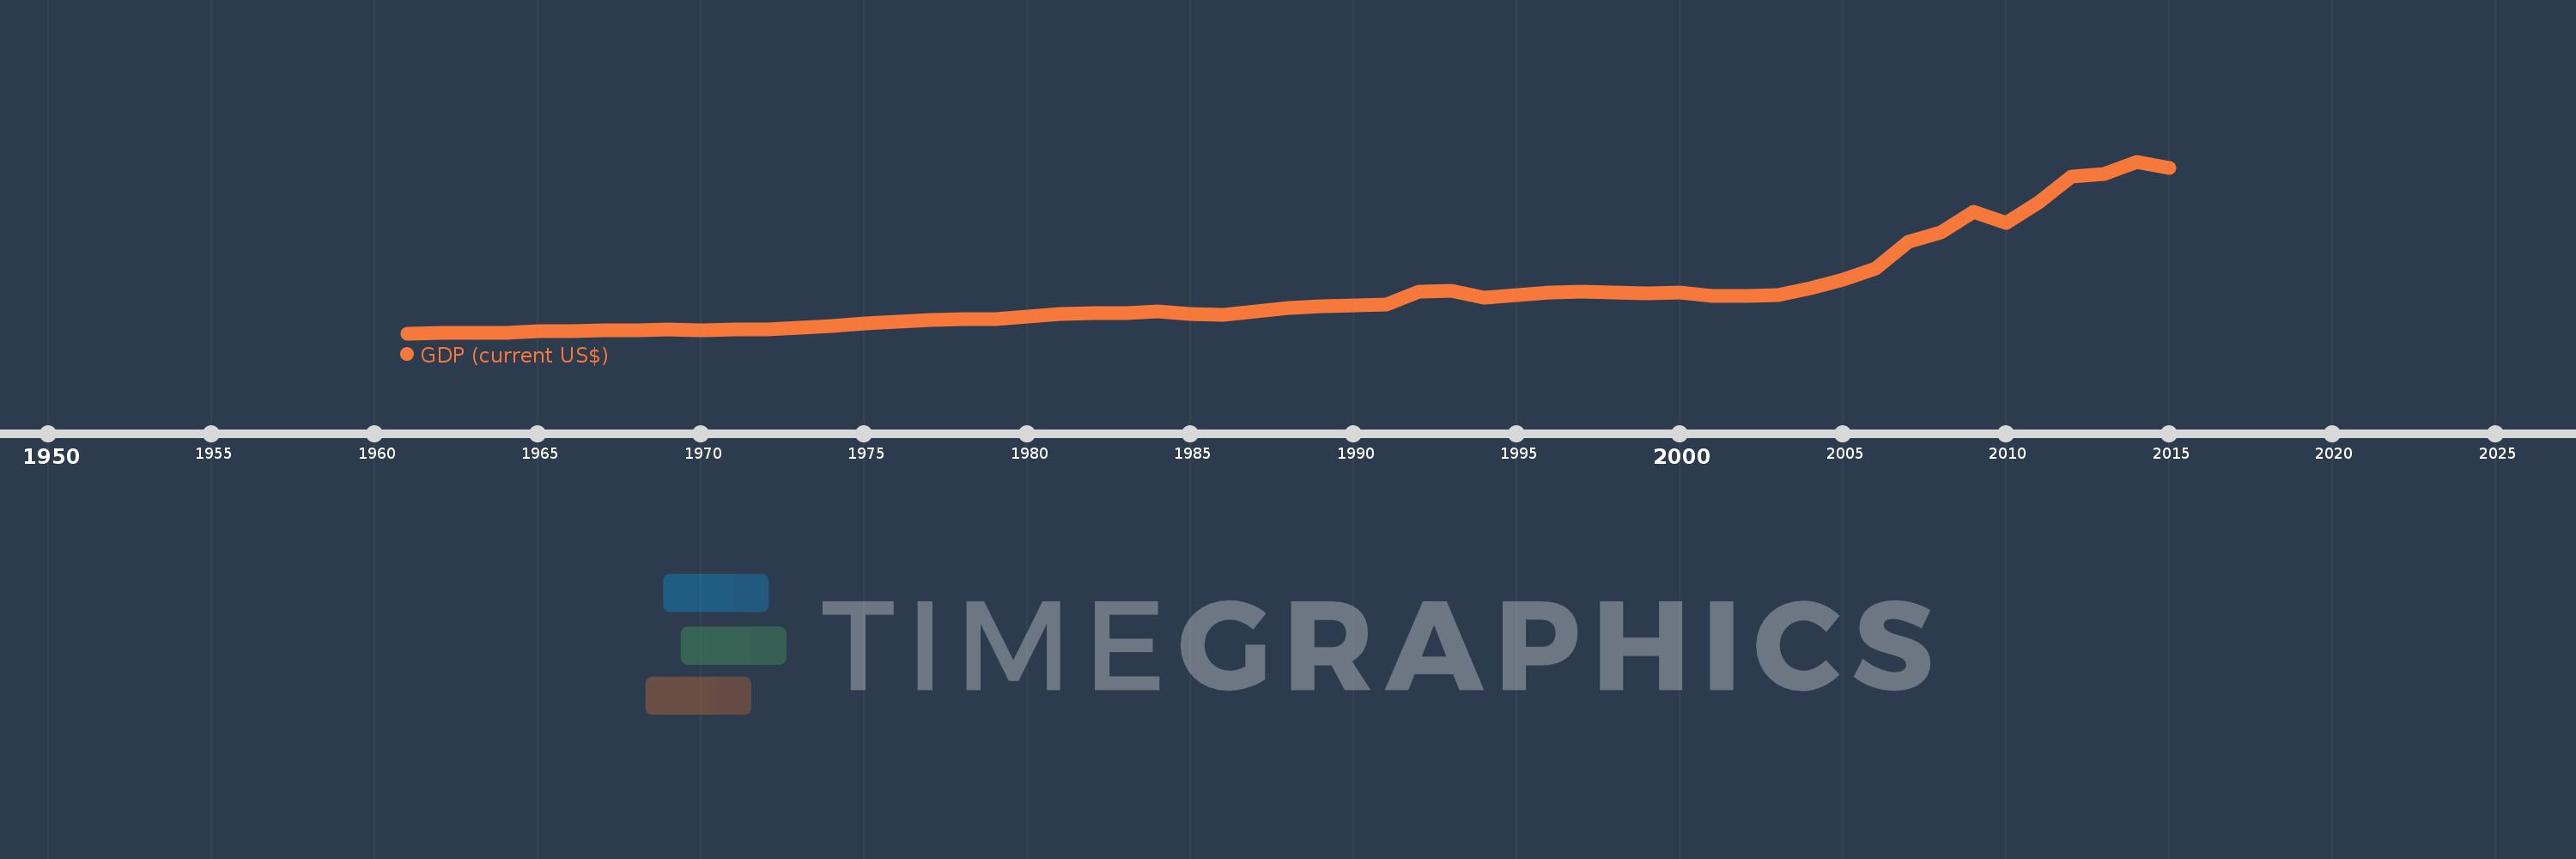
GDP (current US$)
2015,2014,2013,2012,2011,2010,2009,2008,2007,2006,2005,2004,2003,2002,2001,2000,1999,1998,1997,1996,1995,1994,1993,1992,1991,1990,1989,1988,1987,1986,1985,1984,1983,1982,1981,1980,1979,1978,1977,1976,1975,1974,1973,1972,1971,1970,1969,1968,1967,1966,1965,1964,1963,1962,1961
This statistics in other country:
AfghanistanAlbaniaAlgeriaAndorraAngolaAntigua and BarbudaArab WorldArgentinaArmeniaArubaAustraliaAustriaAzerbaijanBahamas, TheBahrainBangladeshBarbadosBelarusBelgiumBelizeBeninBermudaBhutanBoliviaBosnia and HerzegovinaBotswanaBrazilBrunei DarussalamBulgariaBurkina FasoBurundiCabo VerdeCambodiaCameroonCanadaCaribbean small statesCayman IslandsCentral African RepublicCentral Europe and the BalticsChadChannel IslandsChileChinaColombiaComorosCongo, Dem. Rep.Congo, Rep.Costa RicaCote d'IvoireCroatiaCubaCyprusCzech RepublicDenmarkDjiboutiDominicaDominican RepublicEarly-demographic dividendEast Asia & PacificEast Asia & Pacific (excluding high income)East Asia & Pacific (IDA & IBRD countries)EcuadorEgypt, Arab Rep.El SalvadorEquatorial GuineaEritreaEstoniaEthiopiaEuro areaEurope & Central AsiaEurope & Central Asia (excluding high income)Europe & Central Asia (IDA & IBRD countries)European UnionFaroe IslandsFijiFinlandFragile and conflict affected situationsFranceFrench PolynesiaGabonGambia, TheGeorgiaGermanyGhanaGreeceGreenlandGrenadaGuatemalaGuineaGuinea-BissauGuyanaHaitiHeavily indebted poor countries (HIPC)High incomeHondurasHong Kong SAR, ChinaHungaryIBRD onlyIcelandIDA & IBRD totalIDA blendIDA onlyIDA totalIndiaIndonesiaIran, Islamic Rep.IraqIrelandIsle of ManIsraelItalyJamaicaJapanJordanKazakhstanKenyaKiribatiKorea, Rep.KosovoKuwaitKyrgyz RepublicLao PDRLate-demographic dividendLatin America & Caribbean Latin America & Caribbean (excluding high income)Latin America & the Caribbean (IDA & IBRD countries)LatviaLeast developed countries: UN classificationLebanonLesothoLiberiaLibyaLiechtensteinLithuaniaLow & middle incomeLow incomeLower middle incomeLuxembourgMacao SAR, ChinaMacedonia, FYRMadagascarMalawiMalaysiaMaldivesMaliMaltaMarshall IslandsMauritaniaMauritiusMexicoMicronesia, Fed. Sts.Middle East & North AfricaMiddle East & North Africa (excluding high income)Middle East & North Africa (IDA & IBRD countries)Middle incomeMoldovaMonacoMongoliaMontenegroMoroccoMozambiqueMyanmarNamibiaNauruNepalNetherlandsNew CaledoniaNew ZealandNicaraguaNigerNigeriaNorth AmericaNorwayOECD membersOmanOther small statesPacific island small statesPakistanPalauPanamaPapua New GuineaParaguayPeruPhilippinesPolandPortugalPost-demographic dividendPre-demographic dividendPuerto RicoQatarRomaniaRussian FederationRwandaSamoaSan MarinoSao Tome and PrincipeSaudi ArabiaSenegalSerbiaSeychellesSierra LeoneSingaporeSlovak RepublicSloveniaSmall statesSolomon IslandsSomaliaSouth AfricaSouth AsiaSouth Asia (IDA & IBRD)South SudanSpainSri LankaSt. Kitts and NevisSt. LuciaSt. Vincent and the GrenadinesSub-Saharan Africa Sub-Saharan Africa (excluding high income)Sub-Saharan Africa (IDA & IBRD countries)SudanSurinameSwazilandSwedenSwitzerlandSyrian Arab RepublicTajikistanTanzaniaThailandTimor-LesteTogoTongaTrinidad and TobagoTunisiaTurkeyTurkmenistanTuvaluUgandaUkraineUnited Arab EmiratesUnited KingdomUnited StatesUpper middle incomeUruguayUzbekistanVanuatuVenezuela, RBVietnamVirgin Islands (U.S.)West Bank and GazaWorldYemen, Rep.ZambiaZimbabwe Timeline:
This timeline shows a graph from 1961 to 2015 of Mauritania. No data until 1960. Number of actual observations by date: 55.
Source name:
World Development Indicators
Source organization:
World Bank national accounts data, and OECD National Accounts data files.
Categories, topics:
Economy & Growth
Last updated:
apr 23, 2017
Indicators value changes by year
Minimum:
92.609 mln
jan 1, 1961
Maximum:
5.646 bln
jan 1, 2014
At the date of observation
Value
Absolute change
Change from previous value
jan 1, 1961
92.609 mln
+92.609 mln
0.0%
jan 1, 1962
107.726 mln
+15.117 mln
16.32%
jan 1, 1963
111.149 mln
+3.422 mln
3.18%
jan 1, 1964
113.797 mln
+2.649 mln
2.38%
jan 1, 1965
151.897 mln
+38.1 mln
33.48%
jan 1, 1966
172.767 mln
+20.87 mln
13.74%
jan 1, 1967
180.341 mln
+7.573 mln
4.38%
jan 1, 1968
191.222 mln
+10.881 mln
6.03%
jan 1, 1969
210.695 mln
+19.473 mln
10.18%
jan 1, 1970
199.643 mln
-11.052 mln
-5.25%
jan 1, 1971
209.348 mln
+9.705 mln
4.86%
jan 1, 1972
227.051 mln
+17.703 mln
8.46%
jan 1, 1973
265.009 mln
+37.958 mln
16.72%
jan 1, 1974
333.732 mln
+68.722 mln
25.93%
jan 1, 1975
414.772 mln
+81.04 mln
24.28%
jan 1, 1976
475.917 mln
+61.144 mln
14.74%
jan 1, 1977
524.408 mln
+48.491 mln
10.19%
jan 1, 1978
540.635 mln
+16.227 mln
3.09%
jan 1, 1979
544.425 mln
+3.789 mln
0.7%
jan 1, 1980
644.07 mln
+99.646 mln
18.3%
jan 1, 1981
709.041 mln
+64.971 mln
10.09%
jan 1, 1982
747.995 mln
+38.953 mln
5.49%
jan 1, 1983
750.214 mln
+2.22 mln
0.3%
jan 1, 1984
788.372 mln
+38.157 mln
5.09%
jan 1, 1985
726.937 mln
-61.435 mln
-7.79%
jan 1, 1986
683.194 mln
-43.743 mln
-6.02%
jan 1, 1987
802.891 mln
+119.697 mln
17.52%
jan 1, 1988
909.821 mln
+106.93 mln
13.32%
jan 1, 1989
957.378 mln
+47.557 mln
5.23%
jan 1, 1990
981.529 mln
+24.152 mln
2.52%
jan 1, 1991
1.02 bln
+38.071 mln
3.88%
jan 1, 1992
1.444 bln
+424.088 mln
41.59%
jan 1, 1993
1.464 bln
+20.704 mln
1.43%
jan 1, 1994
1.25 bln
-214.447 mln
-14.64%
jan 1, 1995
1.316 bln
+65.988 mln
5.28%
jan 1, 1996
1.415 bln
+99.364 mln
7.55%
jan 1, 1997
1.443 bln
+27.302 mln
1.93%
jan 1, 1998
1.402 bln
-40.652 mln
-2.82%
jan 1, 1999
1.375 bln
-26.831 mln
-1.91%
jan 1, 2000
1.406 bln
+30.547 mln
2.22%
jan 1, 2001
1.294 bln
-112.009 mln
-7.97%
jan 1, 2002
1.296 bln
+1.885 mln
0.15%
jan 1, 2003
1.324 bln
+28.887 mln
2.23%
jan 1, 2004
1.563 bln
+238.648 mln
18.02%
jan 1, 2005
1.833 bln
+270.37 mln
17.3%
jan 1, 2006
2.184 bln
+351.0 mln
19.14%
jan 1, 2007
3.041 bln
+856.272 mln
39.2%
jan 1, 2008
3.357 bln
+316.041 mln
10.39%
jan 1, 2009
4.031 bln
+674.29 mln
20.09%
jan 1, 2010
3.662 bln
-368.766 mln
-9.15%
jan 1, 2011
4.338 bln
+675.51 mln
18.45%
jan 1, 2012
5.166 bln
+828.549 mln
19.1%
jan 1, 2013
5.231 bln
+64.915 mln
1.26%
jan 1, 2014
5.646 bln
+414.484 mln
7.92%
jan 1, 2015
5.442 bln
-203.442 mln
-3.6%
Ranking of countries by current statistics by years


Comments: