29
/
en
AIzaSyAYiBZKx7MnpbEhh9jyipgxe19OcubqV5w
April 1, 2024
145663
Guinea
GIN
true
2
1
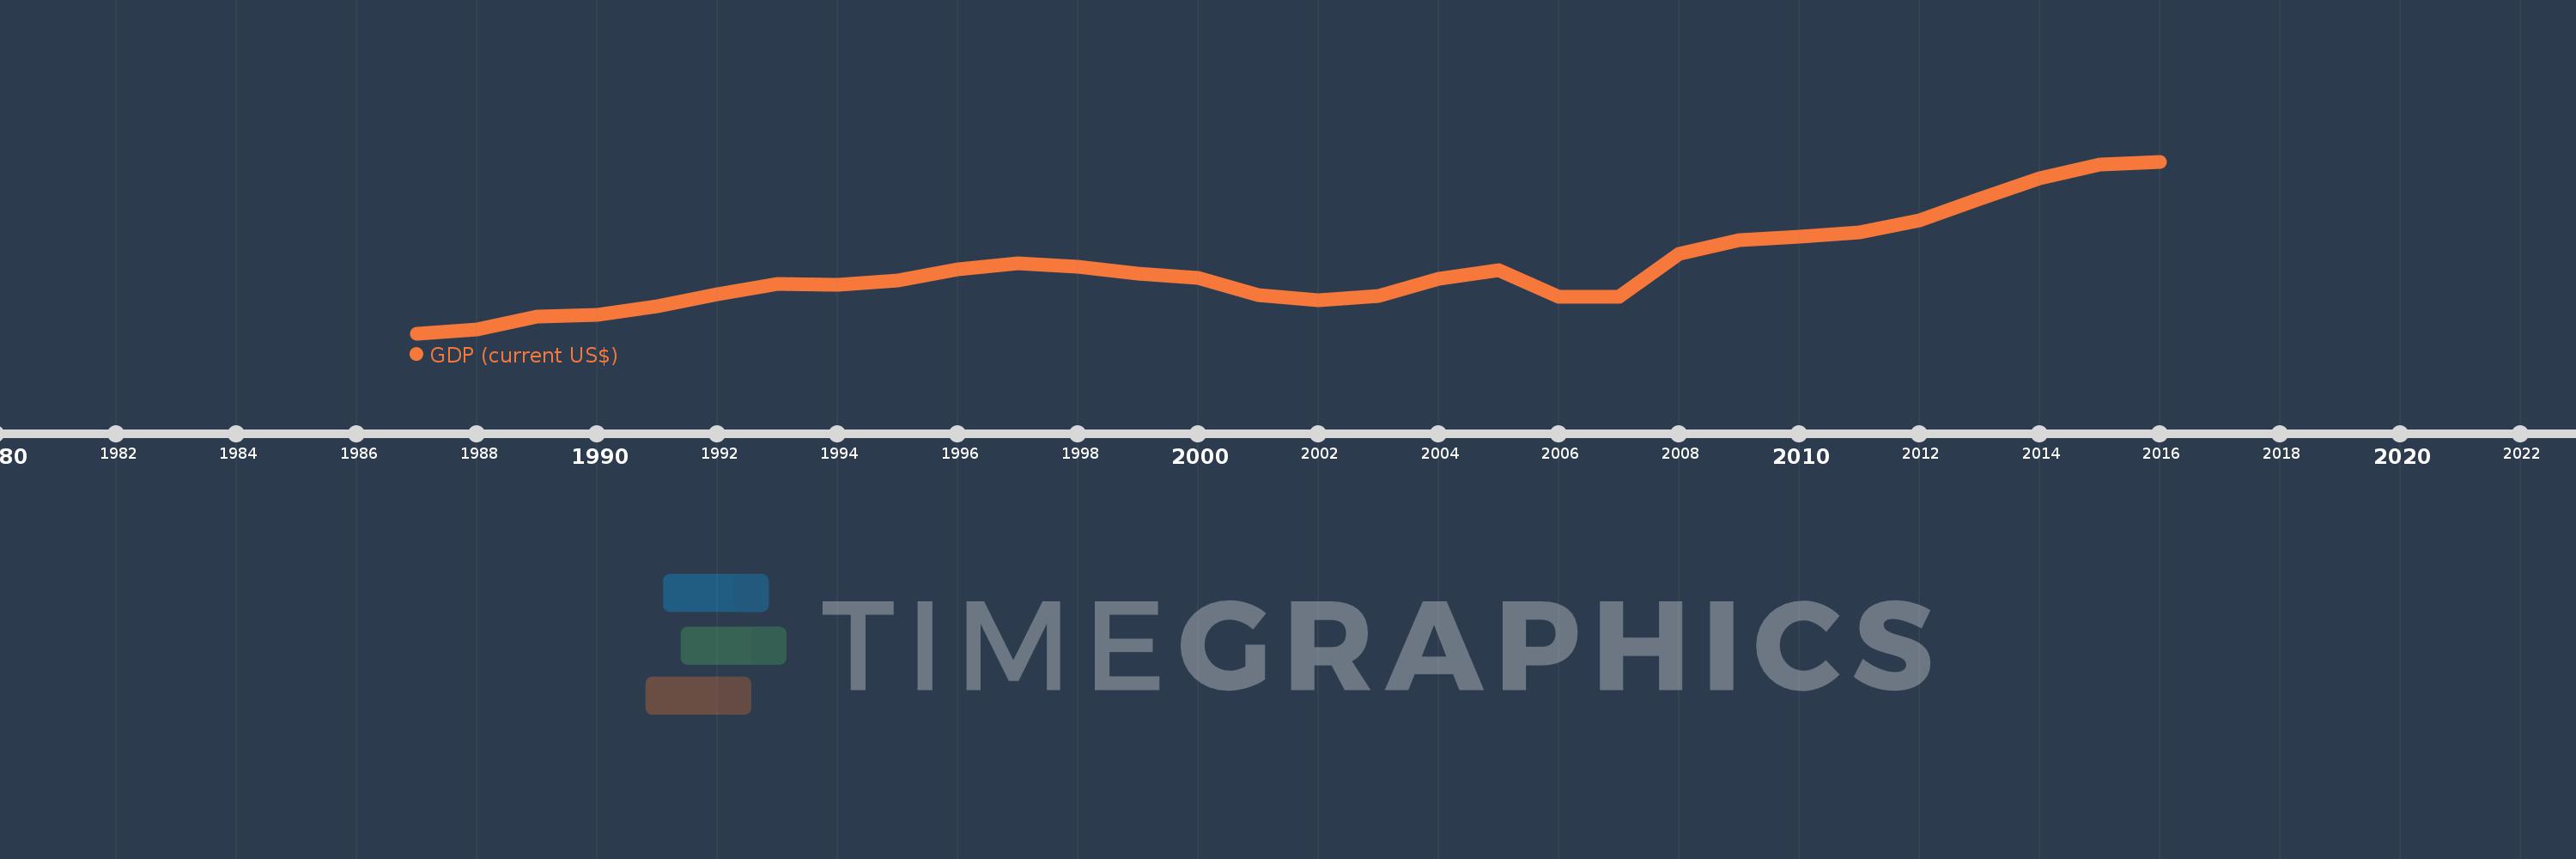
GDP (current US$)
2016,2015,2014,2013,2012,2011,2010,2009,2008,2007,2006,2005,2004,2003,2002,2001,2000,1999,1998,1997,1996,1995,1994,1993,1992,1991,1990,1989,1988,1987
This statistics in other country:
AfghanistanAlbaniaAlgeriaAndorraAngolaAntigua and BarbudaArab WorldArgentinaArmeniaArubaAustraliaAustriaAzerbaijanBahamas, TheBahrainBangladeshBarbadosBelarusBelgiumBelizeBeninBermudaBhutanBoliviaBosnia and HerzegovinaBotswanaBrazilBrunei DarussalamBulgariaBurkina FasoBurundiCabo VerdeCambodiaCameroonCanadaCaribbean small statesCayman IslandsCentral African RepublicCentral Europe and the BalticsChadChannel IslandsChileChinaColombiaComorosCongo, Dem. Rep.Congo, Rep.Costa RicaCote d'IvoireCroatiaCubaCyprusCzech RepublicDenmarkDjiboutiDominicaDominican RepublicEarly-demographic dividendEast Asia & PacificEast Asia & Pacific (excluding high income)East Asia & Pacific (IDA & IBRD countries)EcuadorEgypt, Arab Rep.El SalvadorEquatorial GuineaEritreaEstoniaEthiopiaEuro areaEurope & Central AsiaEurope & Central Asia (excluding high income)Europe & Central Asia (IDA & IBRD countries)European UnionFaroe IslandsFijiFinlandFragile and conflict affected situationsFranceFrench PolynesiaGabonGambia, TheGeorgiaGermanyGhanaGreeceGreenlandGrenadaGuatemalaGuineaGuinea-BissauGuyanaHaitiHeavily indebted poor countries (HIPC)High incomeHondurasHong Kong SAR, ChinaHungaryIBRD onlyIcelandIDA & IBRD totalIDA blendIDA onlyIDA totalIndiaIndonesiaIran, Islamic Rep.IraqIrelandIsle of ManIsraelItalyJamaicaJapanJordanKazakhstanKenyaKiribatiKorea, Rep.KosovoKuwaitKyrgyz RepublicLao PDRLate-demographic dividendLatin America & Caribbean Latin America & Caribbean (excluding high income)Latin America & the Caribbean (IDA & IBRD countries)LatviaLeast developed countries: UN classificationLebanonLesothoLiberiaLibyaLiechtensteinLithuaniaLow & middle incomeLow incomeLower middle incomeLuxembourgMacao SAR, ChinaMacedonia, FYRMadagascarMalawiMalaysiaMaldivesMaliMaltaMarshall IslandsMauritaniaMauritiusMexicoMicronesia, Fed. Sts.Middle East & North AfricaMiddle East & North Africa (excluding high income)Middle East & North Africa (IDA & IBRD countries)Middle incomeMoldovaMonacoMongoliaMontenegroMoroccoMozambiqueMyanmarNamibiaNauruNepalNetherlandsNew CaledoniaNew ZealandNicaraguaNigerNigeriaNorth AmericaNorwayOECD membersOmanOther small statesPacific island small statesPakistanPalauPanamaPapua New GuineaParaguayPeruPhilippinesPolandPortugalPost-demographic dividendPre-demographic dividendPuerto RicoQatarRomaniaRussian FederationRwandaSamoaSan MarinoSao Tome and PrincipeSaudi ArabiaSenegalSerbiaSeychellesSierra LeoneSingaporeSlovak RepublicSloveniaSmall statesSolomon IslandsSomaliaSouth AfricaSouth AsiaSouth Asia (IDA & IBRD)South SudanSpainSri LankaSt. Kitts and NevisSt. LuciaSt. Vincent and the GrenadinesSub-Saharan Africa Sub-Saharan Africa (excluding high income)Sub-Saharan Africa (IDA & IBRD countries)SudanSurinameSwazilandSwedenSwitzerlandSyrian Arab RepublicTajikistanTanzaniaThailandTimor-LesteTogoTongaTrinidad and TobagoTunisiaTurkeyTurkmenistanTuvaluUgandaUkraineUnited Arab EmiratesUnited KingdomUnited StatesUpper middle incomeUruguayUzbekistanVanuatuVenezuela, RBVietnamVirgin Islands (U.S.)West Bank and GazaWorldYemen, Rep.ZambiaZimbabwe Timeline:
This timeline shows a graph from 1987 to 2016 of Guinea. No data until 1986. Number of actual observations by date: 30.
Source name:
World Development Indicators
Source organization:
World Bank national accounts data, and OECD National Accounts data files.
Categories, topics:
Economy & Growth
Last updated:
apr 23, 2017
Indicators value changes by year
Minimum:
1.923 bln
jan 1, 1987
Maximum:
6.699 bln
jan 1, 2016
At the date of observation
Value
Absolute change
Change from previous value
jan 1, 1987
1.923 bln
+1.923 bln
0.0%
jan 1, 1988
2.042 bln
+118.937 mln
6.19%
jan 1, 1989
2.384 bln
+342.758 mln
16.79%
jan 1, 1990
2.432 bln
+47.734 mln
2.0%
jan 1, 1991
2.667 bln
+234.587 mln
9.65%
jan 1, 1992
3.015 bln
+348.274 mln
13.06%
jan 1, 1993
3.285 bln
+269.735 mln
8.95%
jan 1, 1994
3.279 bln
-5.562 mln
-0.17%
jan 1, 1995
3.383 bln
+104.156 mln
3.18%
jan 1, 1996
3.694 bln
+310.534 mln
9.18%
jan 1, 1997
3.869 bln
+175.279 mln
4.75%
jan 1, 1998
3.784 bln
-85.244 mln
-2.2%
jan 1, 1999
3.588 bln
-195.412 mln
-5.16%
jan 1, 2000
3.461 bln
-127.094 mln
-3.54%
jan 1, 2001
2.995 bln
-465.921 mln
-13.46%
jan 1, 2002
2.833 bln
-161.918 mln
-5.41%
jan 1, 2003
2.95 bln
+116.194 mln
4.1%
jan 1, 2004
3.446 bln
+496.805 mln
16.84%
jan 1, 2005
3.666 bln
+219.907 mln
6.38%
jan 1, 2006
2.937 bln
-729.277 mln
-19.89%
jan 1, 2007
2.932 bln
-5.447 mln
-0.19%
jan 1, 2008
4.134 bln
+1.203 bln
41.02%
jan 1, 2009
4.516 bln
+381.651 mln
9.23%
jan 1, 2010
4.61 bln
+94.099 mln
2.08%
jan 1, 2011
4.736 bln
+126.033 mln
2.73%
jan 1, 2012
5.067 bln
+331.404 mln
7.0%
jan 1, 2013
5.667 bln
+599.87 mln
11.84%
jan 1, 2014
6.232 bln
+564.496 mln
9.96%
jan 1, 2015
6.624 bln
+392.343 mln
6.3%
jan 1, 2016
6.699 bln
+75.136 mln
1.13%
Ranking of countries by current statistics by years


Comments: