29
/
en
AIzaSyAYiBZKx7MnpbEhh9jyipgxe19OcubqV5w
April 1, 2024
232227
Samoa
WSM
true
2
1
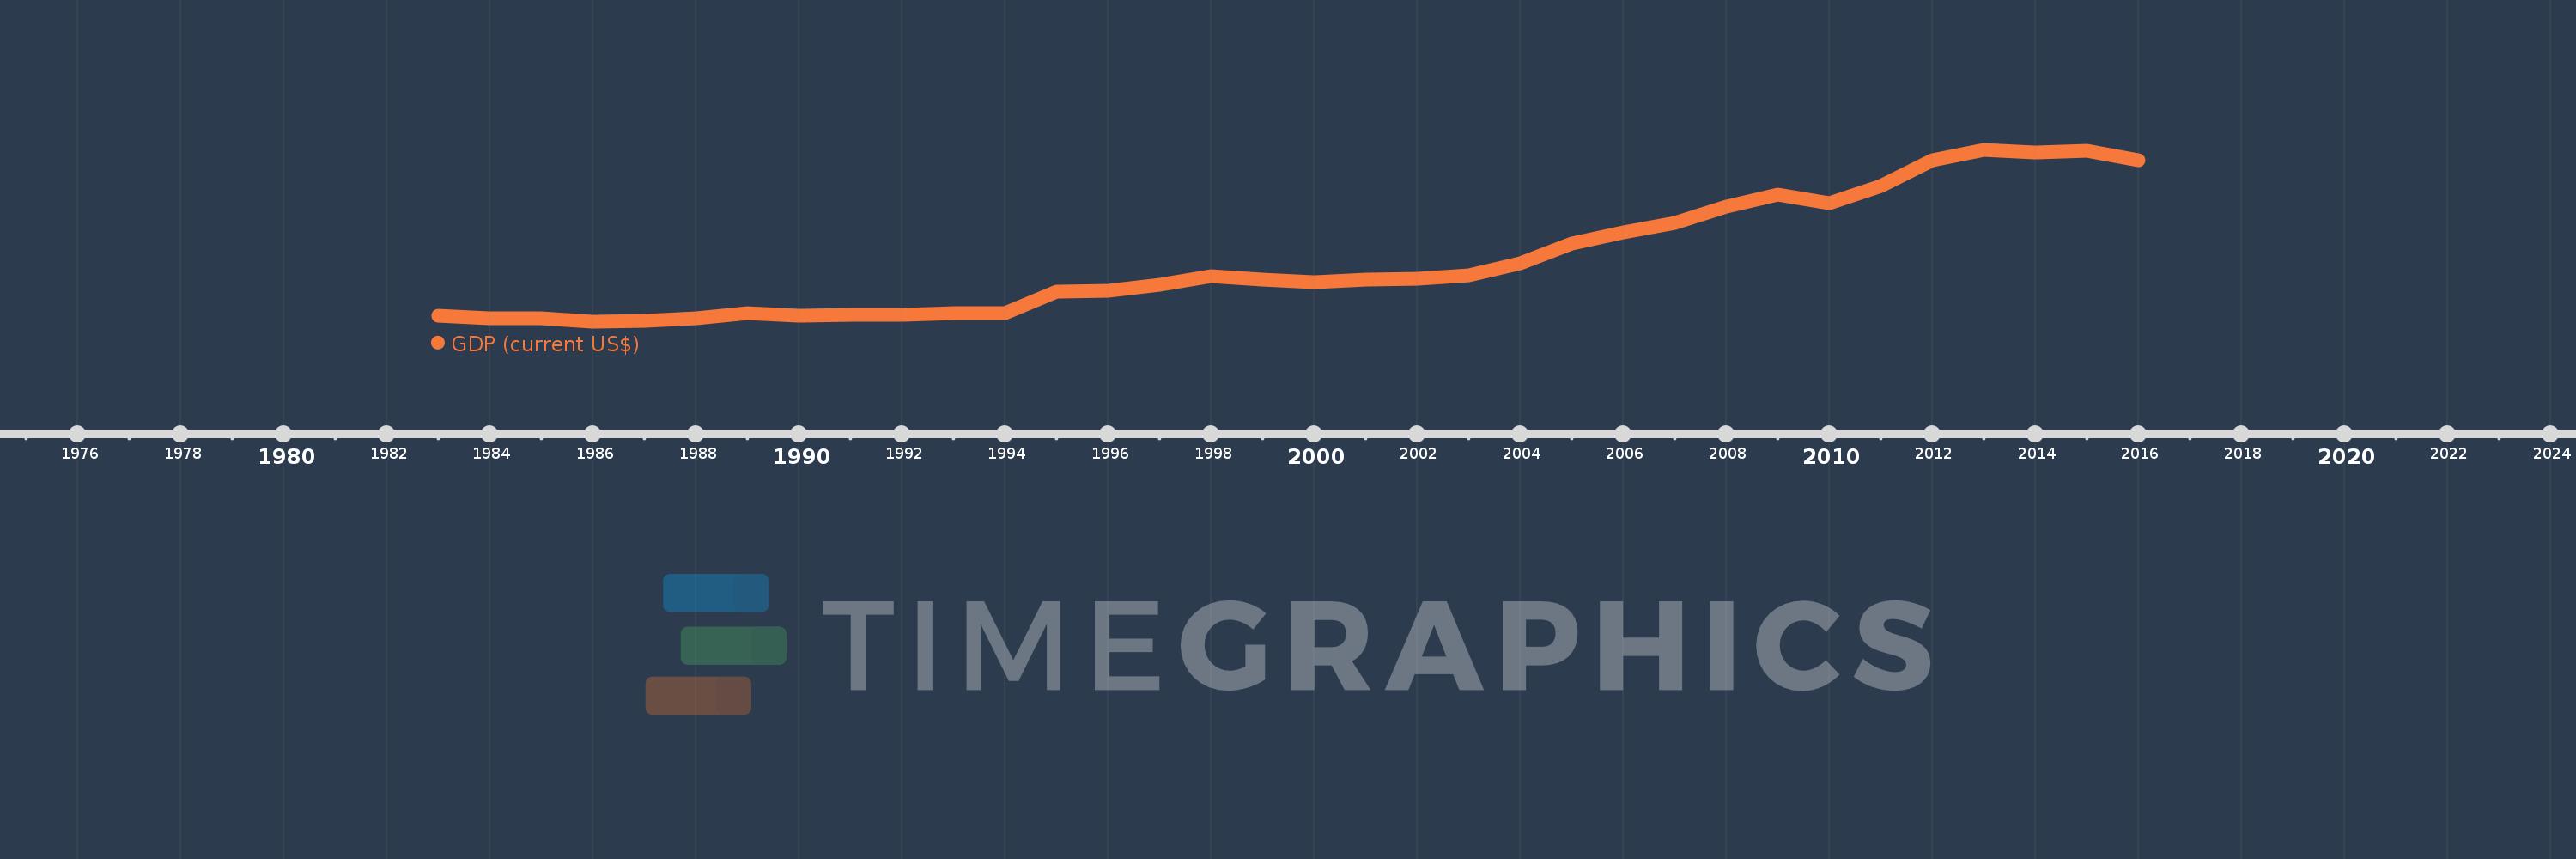
GDP (current US$)
2016,2015,2014,2013,2012,2011,2010,2009,2008,2007,2006,2005,2004,2003,2002,2001,2000,1999,1998,1997,1996,1995,1994,1993,1992,1991,1990,1989,1988,1987,1986,1985,1984,1983
This statistics in other country:
AfghanistanAlbaniaAlgeriaAndorraAngolaAntigua and BarbudaArab WorldArgentinaArmeniaArubaAustraliaAustriaAzerbaijanBahamas, TheBahrainBangladeshBarbadosBelarusBelgiumBelizeBeninBermudaBhutanBoliviaBosnia and HerzegovinaBotswanaBrazilBrunei DarussalamBulgariaBurkina FasoBurundiCabo VerdeCambodiaCameroonCanadaCaribbean small statesCayman IslandsCentral African RepublicCentral Europe and the BalticsChadChannel IslandsChileChinaColombiaComorosCongo, Dem. Rep.Congo, Rep.Costa RicaCote d'IvoireCroatiaCubaCyprusCzech RepublicDenmarkDjiboutiDominicaDominican RepublicEarly-demographic dividendEast Asia & PacificEast Asia & Pacific (excluding high income)East Asia & Pacific (IDA & IBRD countries)EcuadorEgypt, Arab Rep.El SalvadorEquatorial GuineaEritreaEstoniaEthiopiaEuro areaEurope & Central AsiaEurope & Central Asia (excluding high income)Europe & Central Asia (IDA & IBRD countries)European UnionFaroe IslandsFijiFinlandFragile and conflict affected situationsFranceFrench PolynesiaGabonGambia, TheGeorgiaGermanyGhanaGreeceGreenlandGrenadaGuatemalaGuineaGuinea-BissauGuyanaHaitiHeavily indebted poor countries (HIPC)High incomeHondurasHong Kong SAR, ChinaHungaryIBRD onlyIcelandIDA & IBRD totalIDA blendIDA onlyIDA totalIndiaIndonesiaIran, Islamic Rep.IraqIrelandIsle of ManIsraelItalyJamaicaJapanJordanKazakhstanKenyaKiribatiKorea, Rep.KosovoKuwaitKyrgyz RepublicLao PDRLate-demographic dividendLatin America & Caribbean Latin America & Caribbean (excluding high income)Latin America & the Caribbean (IDA & IBRD countries)LatviaLeast developed countries: UN classificationLebanonLesothoLiberiaLibyaLiechtensteinLithuaniaLow & middle incomeLow incomeLower middle incomeLuxembourgMacao SAR, ChinaMacedonia, FYRMadagascarMalawiMalaysiaMaldivesMaliMaltaMarshall IslandsMauritaniaMauritiusMexicoMicronesia, Fed. Sts.Middle East & North AfricaMiddle East & North Africa (excluding high income)Middle East & North Africa (IDA & IBRD countries)Middle incomeMoldovaMonacoMongoliaMontenegroMoroccoMozambiqueMyanmarNamibiaNauruNepalNetherlandsNew CaledoniaNew ZealandNicaraguaNigerNigeriaNorth AmericaNorwayOECD membersOmanOther small statesPacific island small statesPakistanPalauPanamaPapua New GuineaParaguayPeruPhilippinesPolandPortugalPost-demographic dividendPre-demographic dividendPuerto RicoQatarRomaniaRussian FederationRwandaSamoaSan MarinoSao Tome and PrincipeSaudi ArabiaSenegalSerbiaSeychellesSierra LeoneSingaporeSlovak RepublicSloveniaSmall statesSolomon IslandsSomaliaSouth AfricaSouth AsiaSouth Asia (IDA & IBRD)South SudanSpainSri LankaSt. Kitts and NevisSt. LuciaSt. Vincent and the GrenadinesSub-Saharan Africa Sub-Saharan Africa (excluding high income)Sub-Saharan Africa (IDA & IBRD countries)SudanSurinameSwazilandSwedenSwitzerlandSyrian Arab RepublicTajikistanTanzaniaThailandTimor-LesteTogoTongaTrinidad and TobagoTunisiaTurkeyTurkmenistanTuvaluUgandaUkraineUnited Arab EmiratesUnited KingdomUnited StatesUpper middle incomeUruguayUzbekistanVanuatuVenezuela, RBVietnamVirgin Islands (U.S.)West Bank and GazaWorldYemen, Rep.ZambiaZimbabwe Timeline:
This timeline shows a graph from 1983 to 2016 of Samoa. No data until 1982. Number of actual observations by date: 34.
Source name:
World Development Indicators
Source organization:
World Bank national accounts data, and OECD National Accounts data files.
Categories, topics:
Economy & Growth
Last updated:
apr 23, 2017
Indicators value changes by year
Minimum:
95.572 mln
jan 1, 1986
Maximum:
804.209 mln
jan 1, 2013
At the date of observation
Value
Absolute change
Change from previous value
jan 1, 1983
121.222 mln
+121.222 mln
0.0%
jan 1, 1984
111.863 mln
-9.359 mln
-7.72%
jan 1, 1985
109.201 mln
-2.662 mln
-2.38%
jan 1, 1986
95.572 mln
-13.629 mln
-12.48%
jan 1, 1987
100.948 mln
+5.376 mln
5.62%
jan 1, 1988
111.714 mln
+10.766 mln
10.66%
jan 1, 1989
133.016 mln
+21.302 mln
19.07%
jan 1, 1990
122.889 mln
-10.127 mln
-7.61%
jan 1, 1991
125.766 mln
+2.878 mln
2.34%
jan 1, 1992
125.597 mln
-169.064K
-0.13%
jan 1, 1993
132.303 mln
+6.706 mln
5.34%
jan 1, 1994
133.123 mln
+819.856K
0.62%
jan 1, 1995
221.098 mln
+87.975 mln
66.09%
jan 1, 1996
224.866 mln
+3.768 mln
1.7%
jan 1, 1997
249.909 mln
+25.043 mln
11.14%
jan 1, 1998
285.476 mln
+35.567 mln
14.23%
jan 1, 1999
269.482 mln
-15.994 mln
-5.6%
jan 1, 2000
258.834 mln
-10.648 mln
-3.95%
jan 1, 2001
269.02 mln
+10.186 mln
3.94%
jan 1, 2002
273.088 mln
+4.069 mln
1.51%
jan 1, 2003
288.079 mln
+14.991 mln
5.49%
jan 1, 2004
338.839 mln
+50.76 mln
17.62%
jan 1, 2005
420.32 mln
+81.482 mln
24.05%
jan 1, 2006
465.568 mln
+45.248 mln
10.77%
jan 1, 2007
505.832 mln
+40.264 mln
8.65%
jan 1, 2008
570.469 mln
+64.637 mln
12.78%
jan 1, 2009
619.261 mln
+48.792 mln
8.55%
jan 1, 2010
584.706 mln
-34.555 mln
-5.58%
jan 1, 2011
656.789 mln
+72.083 mln
12.33%
jan 1, 2012
762.098 mln
+105.309 mln
16.03%
jan 1, 2013
804.209 mln
+42.111 mln
5.53%
jan 1, 2014
795.754 mln
-8.456 mln
-1.05%
jan 1, 2015
800.419 mln
+4.665 mln
0.59%
jan 1, 2016
761.038 mln
-39.381 mln
-4.92%
Ranking of countries by current statistics by years


Comments: