29
/
en
AIzaSyAYiBZKx7MnpbEhh9jyipgxe19OcubqV5w
April 1, 2024
240447
Singapore
SGP
true
2
1
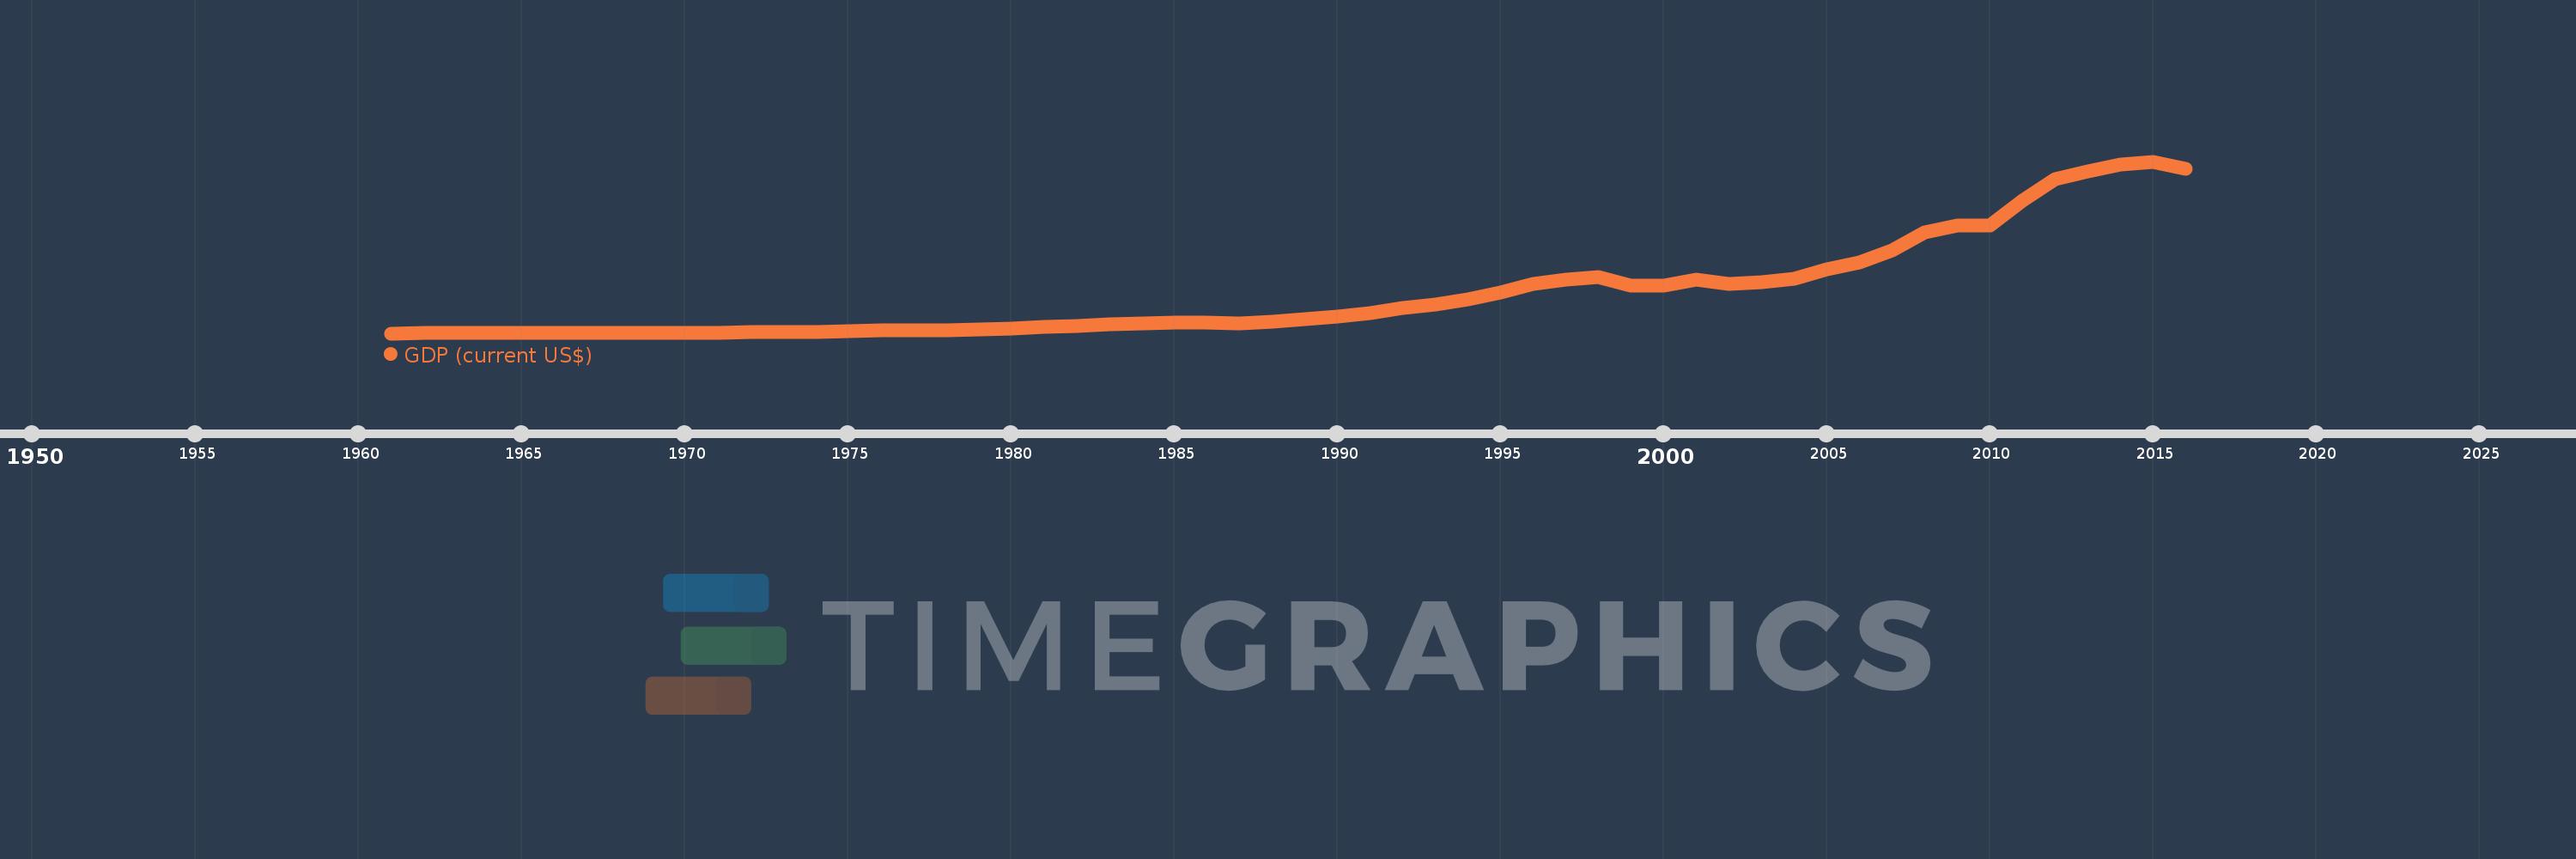
GDP (current US$)
2016,2015,2014,2013,2012,2011,2010,2009,2008,2007,2006,2005,2004,2003,2002,2001,2000,1999,1998,1997,1996,1995,1994,1993,1992,1991,1990,1989,1988,1987,1986,1985,1984,1983,1982,1981,1980,1979,1978,1977,1976,1975,1974,1973,1972,1971,1970,1969,1968,1967,1966,1965,1964,1963,1962,1961
This statistics in other country:
AfghanistanAlbaniaAlgeriaAndorraAngolaAntigua and BarbudaArab WorldArgentinaArmeniaArubaAustraliaAustriaAzerbaijanBahamas, TheBahrainBangladeshBarbadosBelarusBelgiumBelizeBeninBermudaBhutanBoliviaBosnia and HerzegovinaBotswanaBrazilBrunei DarussalamBulgariaBurkina FasoBurundiCabo VerdeCambodiaCameroonCanadaCaribbean small statesCayman IslandsCentral African RepublicCentral Europe and the BalticsChadChannel IslandsChileChinaColombiaComorosCongo, Dem. Rep.Congo, Rep.Costa RicaCote d'IvoireCroatiaCubaCyprusCzech RepublicDenmarkDjiboutiDominicaDominican RepublicEarly-demographic dividendEast Asia & PacificEast Asia & Pacific (excluding high income)East Asia & Pacific (IDA & IBRD countries)EcuadorEgypt, Arab Rep.El SalvadorEquatorial GuineaEritreaEstoniaEthiopiaEuro areaEurope & Central AsiaEurope & Central Asia (excluding high income)Europe & Central Asia (IDA & IBRD countries)European UnionFaroe IslandsFijiFinlandFragile and conflict affected situationsFranceFrench PolynesiaGabonGambia, TheGeorgiaGermanyGhanaGreeceGreenlandGrenadaGuatemalaGuineaGuinea-BissauGuyanaHaitiHeavily indebted poor countries (HIPC)High incomeHondurasHong Kong SAR, ChinaHungaryIBRD onlyIcelandIDA & IBRD totalIDA blendIDA onlyIDA totalIndiaIndonesiaIran, Islamic Rep.IraqIrelandIsle of ManIsraelItalyJamaicaJapanJordanKazakhstanKenyaKiribatiKorea, Rep.KosovoKuwaitKyrgyz RepublicLao PDRLate-demographic dividendLatin America & Caribbean Latin America & Caribbean (excluding high income)Latin America & the Caribbean (IDA & IBRD countries)LatviaLeast developed countries: UN classificationLebanonLesothoLiberiaLibyaLiechtensteinLithuaniaLow & middle incomeLow incomeLower middle incomeLuxembourgMacao SAR, ChinaMacedonia, FYRMadagascarMalawiMalaysiaMaldivesMaliMaltaMarshall IslandsMauritaniaMauritiusMexicoMicronesia, Fed. Sts.Middle East & North AfricaMiddle East & North Africa (excluding high income)Middle East & North Africa (IDA & IBRD countries)Middle incomeMoldovaMonacoMongoliaMontenegroMoroccoMozambiqueMyanmarNamibiaNauruNepalNetherlandsNew CaledoniaNew ZealandNicaraguaNigerNigeriaNorth AmericaNorwayOECD membersOmanOther small statesPacific island small statesPakistanPalauPanamaPapua New GuineaParaguayPeruPhilippinesPolandPortugalPost-demographic dividendPre-demographic dividendPuerto RicoQatarRomaniaRussian FederationRwandaSamoaSan MarinoSao Tome and PrincipeSaudi ArabiaSenegalSerbiaSeychellesSierra LeoneSingaporeSlovak RepublicSloveniaSmall statesSolomon IslandsSomaliaSouth AfricaSouth AsiaSouth Asia (IDA & IBRD)South SudanSpainSri LankaSt. Kitts and NevisSt. LuciaSt. Vincent and the GrenadinesSub-Saharan Africa Sub-Saharan Africa (excluding high income)Sub-Saharan Africa (IDA & IBRD countries)SudanSurinameSwazilandSwedenSwitzerlandSyrian Arab RepublicTajikistanTanzaniaThailandTimor-LesteTogoTongaTrinidad and TobagoTunisiaTurkeyTurkmenistanTuvaluUgandaUkraineUnited Arab EmiratesUnited KingdomUnited StatesUpper middle incomeUruguayUzbekistanVanuatuVenezuela, RBVietnamVirgin Islands (U.S.)West Bank and GazaWorldYemen, Rep.ZambiaZimbabwe Timeline:
This timeline shows a graph from 1961 to 2016 of Singapore. No data until 1960. Number of actual observations by date: 56.
Source name:
World Development Indicators
Source organization:
World Bank national accounts data, and OECD National Accounts data files.
Categories, topics:
Economy & Growth
Last updated:
apr 23, 2017
Indicators value changes by year
Minimum:
704.462 mln
jan 1, 1961
Maximum:
306.344 bln
jan 1, 2015
At the date of observation
Value
Absolute change
Change from previous value
jan 1, 1961
704.462 mln
+704.462 mln
0.0%
jan 1, 1962
764.308 mln
+59.846 mln
8.5%
jan 1, 1963
825.885 mln
+61.577 mln
8.06%
jan 1, 1964
917.222 mln
+91.337 mln
11.06%
jan 1, 1965
893.734 mln
-23.488 mln
-2.56%
jan 1, 1966
974.193 mln
+80.459 mln
9.0%
jan 1, 1967
1.096 bln
+121.717 mln
12.49%
jan 1, 1968
1.237 bln
+141.513 mln
12.91%
jan 1, 1969
1.425 bln
+187.606 mln
15.16%
jan 1, 1970
1.659 bln
+234.026 mln
16.42%
jan 1, 1971
1.92 bln
+260.453 mln
15.7%
jan 1, 1972
2.263 bln
+343.035 mln
17.87%
jan 1, 1973
2.72 bln
+457.356 mln
20.21%
jan 1, 1974
3.694 bln
+973.86 mln
35.8%
jan 1, 1975
5.217 bln
+1.523 bln
41.23%
jan 1, 1976
5.633 bln
+416.613 mln
7.99%
jan 1, 1977
6.326 bln
+693.059 mln
12.3%
jan 1, 1978
6.618 bln
+291.087 mln
4.6%
jan 1, 1979
7.516 bln
+898.291 mln
13.57%
jan 1, 1980
9.295 bln
+1.779 bln
23.67%
jan 1, 1981
11.893 bln
+2.599 bln
27.96%
jan 1, 1982
14.172 bln
+2.278 bln
19.16%
jan 1, 1983
16.079 bln
+1.907 bln
13.46%
jan 1, 1984
17.775 bln
+1.696 bln
10.55%
jan 1, 1985
19.736 bln
+1.961 bln
11.03%
jan 1, 1986
19.138 bln
-597.624 mln
-3.03%
jan 1, 1987
18.569 bln
-569.004 mln
-2.97%
jan 1, 1988
20.898 bln
+2.328 bln
12.54%
jan 1, 1989
25.337 bln
+4.44 bln
21.24%
jan 1, 1990
30.424 bln
+5.086 bln
20.07%
jan 1, 1991
36.152 bln
+5.728 bln
18.83%
jan 1, 1992
45.474 bln
+9.322 bln
25.79%
jan 1, 1993
52.156 bln
+6.682 bln
14.69%
jan 1, 1994
60.645 bln
+8.488 bln
16.27%
jan 1, 1995
73.778 bln
+13.133 bln
21.66%
jan 1, 1996
87.89 bln
+14.112 bln
19.13%
jan 1, 1997
96.404 bln
+8.514 bln
9.69%
jan 1, 1998
100.164 bln
+3.76 bln
3.9%
jan 1, 1999
85.708 bln
-14.456 bln
-14.43%
jan 1, 2000
86.283 bln
+575.491 mln
0.67%
jan 1, 2001
95.834 bln
+9.551 bln
11.07%
jan 1, 2002
89.286 bln
-6.548 bln
-6.83%
jan 1, 2003
91.941 bln
+2.655 bln
2.97%
jan 1, 2004
97.001 bln
+5.06 bln
5.5%
jan 1, 2005
114.189 bln
+17.187 bln
17.72%
jan 1, 2006
127.418 bln
+13.229 bln
11.59%
jan 1, 2007
147.797 bln
+20.38 bln
15.99%
jan 1, 2008
179.981 bln
+32.184 bln
21.78%
jan 1, 2009
192.226 bln
+12.245 bln
6.8%
jan 1, 2010
192.408 bln
+182.506 mln
0.09%
jan 1, 2011
236.422 bln
+44.013 bln
22.87%
jan 1, 2012
275.221 bln
+38.799 bln
16.41%
jan 1, 2013
289.269 bln
+14.048 bln
5.1%
jan 1, 2014
300.288 bln
+11.02 bln
3.81%
jan 1, 2015
306.344 bln
+6.056 bln
2.02%
jan 1, 2016
292.739 bln
-13.605 bln
-4.44%
Ranking of countries by current statistics by years


Comments: