29
/
en
AIzaSyAYiBZKx7MnpbEhh9jyipgxe19OcubqV5w
April 1, 2024
182924
Macao SAR, China
MAC
true
2
1
GDP (current US$)
2016,2015,2014,2013,2012,2011,2010,2009,2008,2007,2006,2005,2004,2003,2002,2001,2000,1999,1998,1997,1996,1995,1994,1993,1992,1991,1990,1989,1988,1987,1986,1985,1984,1983
This statistics in other country:
AfghanistanAlbaniaAlgeriaAndorraAngolaAntigua and BarbudaArab WorldArgentinaArmeniaArubaAustraliaAustriaAzerbaijanBahamas, TheBahrainBangladeshBarbadosBelarusBelgiumBelizeBeninBermudaBhutanBoliviaBosnia and HerzegovinaBotswanaBrazilBrunei DarussalamBulgariaBurkina FasoBurundiCabo VerdeCambodiaCameroonCanadaCaribbean small statesCayman IslandsCentral African RepublicCentral Europe and the BalticsChadChannel IslandsChileChinaColombiaComorosCongo, Dem. Rep.Congo, Rep.Costa RicaCote d'IvoireCroatiaCubaCyprusCzech RepublicDenmarkDjiboutiDominicaDominican RepublicEarly-demographic dividendEast Asia & PacificEast Asia & Pacific (excluding high income)East Asia & Pacific (IDA & IBRD countries)EcuadorEgypt, Arab Rep.El SalvadorEquatorial GuineaEritreaEstoniaEthiopiaEuro areaEurope & Central AsiaEurope & Central Asia (excluding high income)Europe & Central Asia (IDA & IBRD countries)European UnionFaroe IslandsFijiFinlandFragile and conflict affected situationsFranceFrench PolynesiaGabonGambia, TheGeorgiaGermanyGhanaGreeceGreenlandGrenadaGuatemalaGuineaGuinea-BissauGuyanaHaitiHeavily indebted poor countries (HIPC)High incomeHondurasHong Kong SAR, ChinaHungaryIBRD onlyIcelandIDA & IBRD totalIDA blendIDA onlyIDA totalIndiaIndonesiaIran, Islamic Rep.IraqIrelandIsle of ManIsraelItalyJamaicaJapanJordanKazakhstanKenyaKiribatiKorea, Rep.KosovoKuwaitKyrgyz RepublicLao PDRLate-demographic dividendLatin America & Caribbean Latin America & Caribbean (excluding high income)Latin America & the Caribbean (IDA & IBRD countries)LatviaLeast developed countries: UN classificationLebanonLesothoLiberiaLibyaLiechtensteinLithuaniaLow & middle incomeLow incomeLower middle incomeLuxembourgMacao SAR, ChinaMacedonia, FYRMadagascarMalawiMalaysiaMaldivesMaliMaltaMarshall IslandsMauritaniaMauritiusMexicoMicronesia, Fed. Sts.Middle East & North AfricaMiddle East & North Africa (excluding high income)Middle East & North Africa (IDA & IBRD countries)Middle incomeMoldovaMonacoMongoliaMontenegroMoroccoMozambiqueMyanmarNamibiaNauruNepalNetherlandsNew CaledoniaNew ZealandNicaraguaNigerNigeriaNorth AmericaNorwayOECD membersOmanOther small statesPacific island small statesPakistanPalauPanamaPapua New GuineaParaguayPeruPhilippinesPolandPortugalPost-demographic dividendPre-demographic dividendPuerto RicoQatarRomaniaRussian FederationRwandaSamoaSan MarinoSao Tome and PrincipeSaudi ArabiaSenegalSerbiaSeychellesSierra LeoneSingaporeSlovak RepublicSloveniaSmall statesSolomon IslandsSomaliaSouth AfricaSouth AsiaSouth Asia (IDA & IBRD)South SudanSpainSri LankaSt. Kitts and NevisSt. LuciaSt. Vincent and the GrenadinesSub-Saharan Africa Sub-Saharan Africa (excluding high income)Sub-Saharan Africa (IDA & IBRD countries)SudanSurinameSwazilandSwedenSwitzerlandSyrian Arab RepublicTajikistanTanzaniaThailandTimor-LesteTogoTongaTrinidad and TobagoTunisiaTurkeyTurkmenistanTuvaluUgandaUkraineUnited Arab EmiratesUnited KingdomUnited StatesUpper middle incomeUruguayUzbekistanVanuatuVenezuela, RBVietnamVirgin Islands (U.S.)West Bank and GazaWorldYemen, Rep.ZambiaZimbabwe Timeline:
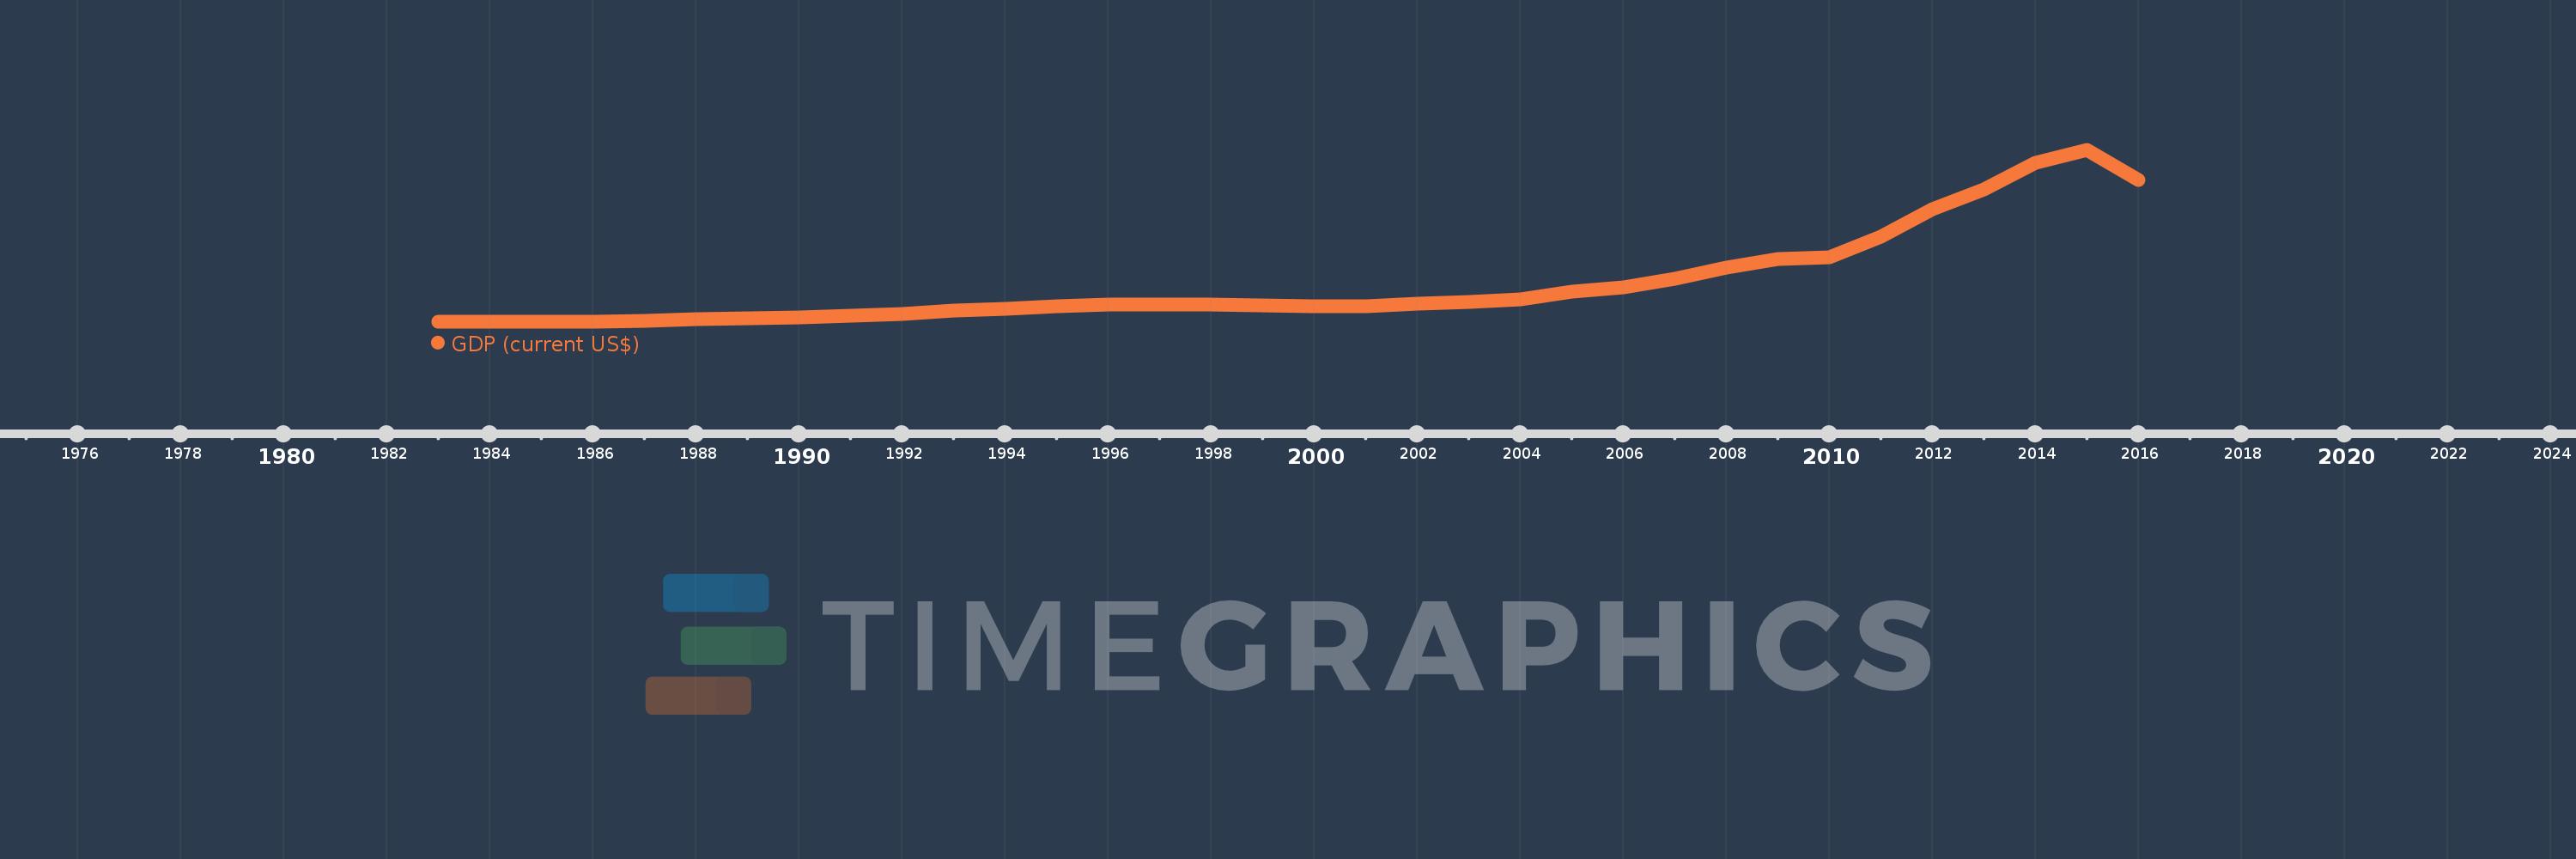
This timeline shows a graph from 1983 to 2016 of Macao SAR, China. No data until 1982. Number of actual observations by date: 34.
Source name:
World Development Indicators
Source organization:
World Bank national accounts data, and OECD National Accounts data files.
Categories, topics:
Economy & Growth
Last updated:
apr 23, 2017
Indicators value changes by year
Minimum:
1.017 bln
jan 1, 1984
Maximum:
55.523 bln
jan 1, 2015
At the date of observation
Value
Absolute change
Change from previous value
jan 1, 1983
1.022 bln
+1.022 bln
0.0%
jan 1, 1984
1.017 bln
-5.079 mln
-0.5%
jan 1, 1985
1.183 bln
+166.12 mln
16.34%
jan 1, 1986
1.222 bln
+39.378 mln
3.33%
jan 1, 1987
1.376 bln
+153.989 mln
12.6%
jan 1, 1988
1.787 bln
+410.668 mln
29.84%
jan 1, 1989
2.087 bln
+300.384 mln
16.81%
jan 1, 1990
2.479 bln
+391.682 mln
18.77%
jan 1, 1991
2.99 bln
+511.375 mln
20.63%
jan 1, 1992
3.465 bln
+474.747 mln
15.88%
jan 1, 1993
4.581 bln
+1.116 bln
32.22%
jan 1, 1994
5.28 bln
+698.975 mln
15.26%
jan 1, 1995
5.869 bln
+588.349 mln
11.14%
jan 1, 1996
6.561 bln
+692.104 mln
11.79%
jan 1, 1997
6.629 bln
+67.888 mln
1.03%
jan 1, 1998
6.675 bln
+46.02 mln
0.69%
jan 1, 1999
6.186 bln
-488.096 mln
-7.31%
jan 1, 2000
5.917 bln
-269.53 mln
-4.36%
jan 1, 2001
6.102 bln
+184.875 mln
3.12%
jan 1, 2002
6.811 bln
+709.458 mln
11.63%
jan 1, 2003
7.323 bln
+511.437 mln
7.51%
jan 1, 2004
8.195 bln
+872.305 mln
11.91%
jan 1, 2005
10.586 bln
+2.391 bln
29.17%
jan 1, 2006
12.092 bln
+1.507 bln
14.23%
jan 1, 2007
14.79 bln
+2.697 bln
22.31%
jan 1, 2008
18.34 bln
+3.551 bln
24.01%
jan 1, 2009
20.917 bln
+2.577 bln
14.05%
jan 1, 2010
21.476 bln
+558.063 mln
2.67%
jan 1, 2011
28.124 bln
+6.648 bln
30.96%
jan 1, 2012
36.71 bln
+8.586 bln
30.53%
jan 1, 2013
43.029 bln
+6.319 bln
17.21%
jan 1, 2014
51.549 bln
+8.52 bln
19.8%
jan 1, 2015
55.523 bln
+3.974 bln
7.71%
jan 1, 2016
46.178 bln
-9.345 bln
-16.83%
Ranking of countries by current statistics by years


Comments: