29
/
en
AIzaSyAYiBZKx7MnpbEhh9jyipgxe19OcubqV5w
April 1, 2024
185171
Madagascar
MDG
true
2
1
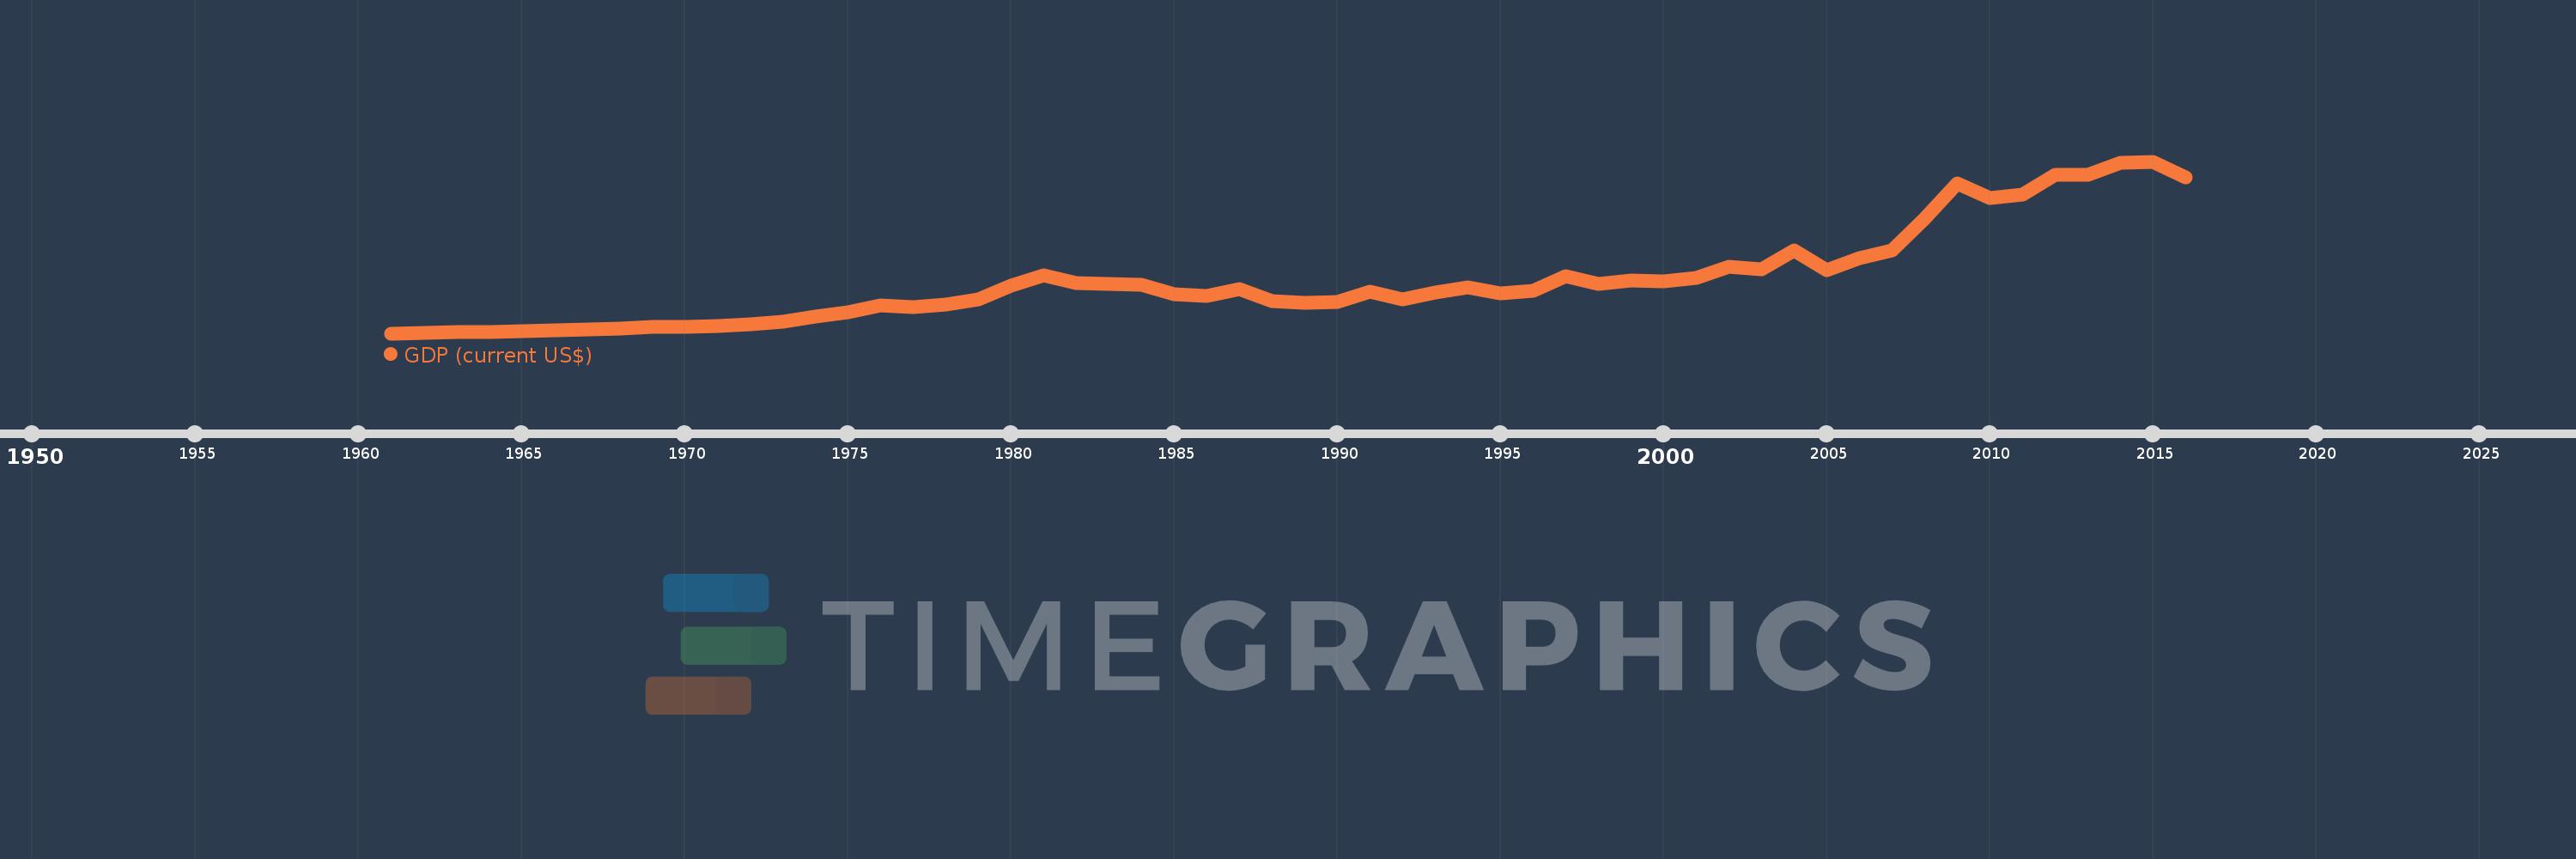
GDP (current US$)
2016,2015,2014,2013,2012,2011,2010,2009,2008,2007,2006,2005,2004,2003,2002,2001,2000,1999,1998,1997,1996,1995,1994,1993,1992,1991,1990,1989,1988,1987,1986,1985,1984,1983,1982,1981,1980,1979,1978,1977,1976,1975,1974,1973,1972,1971,1970,1969,1968,1967,1966,1965,1964,1963,1962,1961
This statistics in other country:
AfghanistanAlbaniaAlgeriaAndorraAngolaAntigua and BarbudaArab WorldArgentinaArmeniaArubaAustraliaAustriaAzerbaijanBahamas, TheBahrainBangladeshBarbadosBelarusBelgiumBelizeBeninBermudaBhutanBoliviaBosnia and HerzegovinaBotswanaBrazilBrunei DarussalamBulgariaBurkina FasoBurundiCabo VerdeCambodiaCameroonCanadaCaribbean small statesCayman IslandsCentral African RepublicCentral Europe and the BalticsChadChannel IslandsChileChinaColombiaComorosCongo, Dem. Rep.Congo, Rep.Costa RicaCote d'IvoireCroatiaCubaCyprusCzech RepublicDenmarkDjiboutiDominicaDominican RepublicEarly-demographic dividendEast Asia & PacificEast Asia & Pacific (excluding high income)East Asia & Pacific (IDA & IBRD countries)EcuadorEgypt, Arab Rep.El SalvadorEquatorial GuineaEritreaEstoniaEthiopiaEuro areaEurope & Central AsiaEurope & Central Asia (excluding high income)Europe & Central Asia (IDA & IBRD countries)European UnionFaroe IslandsFijiFinlandFragile and conflict affected situationsFranceFrench PolynesiaGabonGambia, TheGeorgiaGermanyGhanaGreeceGreenlandGrenadaGuatemalaGuineaGuinea-BissauGuyanaHaitiHeavily indebted poor countries (HIPC)High incomeHondurasHong Kong SAR, ChinaHungaryIBRD onlyIcelandIDA & IBRD totalIDA blendIDA onlyIDA totalIndiaIndonesiaIran, Islamic Rep.IraqIrelandIsle of ManIsraelItalyJamaicaJapanJordanKazakhstanKenyaKiribatiKorea, Rep.KosovoKuwaitKyrgyz RepublicLao PDRLate-demographic dividendLatin America & Caribbean Latin America & Caribbean (excluding high income)Latin America & the Caribbean (IDA & IBRD countries)LatviaLeast developed countries: UN classificationLebanonLesothoLiberiaLibyaLiechtensteinLithuaniaLow & middle incomeLow incomeLower middle incomeLuxembourgMacao SAR, ChinaMacedonia, FYRMadagascarMalawiMalaysiaMaldivesMaliMaltaMarshall IslandsMauritaniaMauritiusMexicoMicronesia, Fed. Sts.Middle East & North AfricaMiddle East & North Africa (excluding high income)Middle East & North Africa (IDA & IBRD countries)Middle incomeMoldovaMonacoMongoliaMontenegroMoroccoMozambiqueMyanmarNamibiaNauruNepalNetherlandsNew CaledoniaNew ZealandNicaraguaNigerNigeriaNorth AmericaNorwayOECD membersOmanOther small statesPacific island small statesPakistanPalauPanamaPapua New GuineaParaguayPeruPhilippinesPolandPortugalPost-demographic dividendPre-demographic dividendPuerto RicoQatarRomaniaRussian FederationRwandaSamoaSan MarinoSao Tome and PrincipeSaudi ArabiaSenegalSerbiaSeychellesSierra LeoneSingaporeSlovak RepublicSloveniaSmall statesSolomon IslandsSomaliaSouth AfricaSouth AsiaSouth Asia (IDA & IBRD)South SudanSpainSri LankaSt. Kitts and NevisSt. LuciaSt. Vincent and the GrenadinesSub-Saharan Africa Sub-Saharan Africa (excluding high income)Sub-Saharan Africa (IDA & IBRD countries)SudanSurinameSwazilandSwedenSwitzerlandSyrian Arab RepublicTajikistanTanzaniaThailandTimor-LesteTogoTongaTrinidad and TobagoTunisiaTurkeyTurkmenistanTuvaluUgandaUkraineUnited Arab EmiratesUnited KingdomUnited StatesUpper middle incomeUruguayUzbekistanVanuatuVenezuela, RBVietnamVirgin Islands (U.S.)West Bank and GazaWorldYemen, Rep.ZambiaZimbabwe Timeline:
This timeline shows a graph from 1961 to 2016 of Madagascar. No data until 1960. Number of actual observations by date: 56.
Source name:
World Development Indicators
Source organization:
World Bank national accounts data, and OECD National Accounts data files.
Categories, topics:
Economy & Growth
Last updated:
apr 23, 2017
Indicators value changes by year
Minimum:
673.082 mln
jan 1, 1961
Maximum:
10.674 bln
jan 1, 2015
At the date of observation
Value
Absolute change
Change from previous value
jan 1, 1961
673.082 mln
+673.082 mln
0.0%
jan 1, 1962
699.162 mln
+26.08 mln
3.87%
jan 1, 1963
739.287 mln
+40.125 mln
5.74%
jan 1, 1964
759.346 mln
+20.059 mln
2.71%
jan 1, 1965
802.482 mln
+43.136 mln
5.68%
jan 1, 1966
833.563 mln
+31.081 mln
3.87%
jan 1, 1967
900.265 mln
+66.701 mln
8.0%
jan 1, 1968
956.437 mln
+56.172 mln
6.24%
jan 1, 1969
1.032 bln
+75.233 mln
7.87%
jan 1, 1970
1.056 bln
+24.721 mln
2.4%
jan 1, 1971
1.112 bln
+55.469 mln
5.25%
jan 1, 1972
1.2 bln
+87.648 mln
7.88%
jan 1, 1973
1.342 bln
+142.083 mln
11.85%
jan 1, 1974
1.653 bln
+311.472 mln
23.22%
jan 1, 1975
1.918 bln
+264.446 mln
16.0%
jan 1, 1976
2.283 bln
+365.541 mln
19.06%
jan 1, 1977
2.182 bln
-101.205 mln
-4.43%
jan 1, 1978
2.359 bln
+177.086 mln
8.12%
jan 1, 1979
2.67 bln
+310.825 mln
13.18%
jan 1, 1980
3.464 bln
+793.811 mln
29.73%
jan 1, 1981
4.042 bln
+578.574 mln
16.7%
jan 1, 1982
3.595 bln
-447.272 mln
-11.07%
jan 1, 1983
3.526 bln
-68.67 mln
-1.91%
jan 1, 1984
3.512 bln
-14.624 mln
-0.41%
jan 1, 1985
2.939 bln
-572.089 mln
-16.29%
jan 1, 1986
2.858 bln
-81.596 mln
-2.78%
jan 1, 1987
3.258 bln
+400.399 mln
14.01%
jan 1, 1988
2.566 bln
-692.655 mln
-21.26%
jan 1, 1989
2.443 bln
-123.127 mln
-4.8%
jan 1, 1990
2.498 bln
+55.551 mln
2.27%
jan 1, 1991
3.081 bln
+583.421 mln
23.35%
jan 1, 1992
2.653 bln
-428.338 mln
-13.9%
jan 1, 1993
3.024 bln
+371.318 mln
14.0%
jan 1, 1994
3.371 bln
+346.383 mln
11.45%
jan 1, 1995
2.977 bln
-393.801 mln
-11.68%
jan 1, 1996
3.16 bln
+182.861 mln
6.14%
jan 1, 1997
3.995 bln
+835.127 mln
26.43%
jan 1, 1998
3.546 bln
-449.252 mln
-11.25%
jan 1, 1999
3.739 bln
+192.928 mln
5.44%
jan 1, 2000
3.718 bln
-21.189 mln
-0.57%
jan 1, 2001
3.878 bln
+160.158 mln
4.31%
jan 1, 2002
4.53 bln
+651.902 mln
16.81%
jan 1, 2003
4.397 bln
-132.321 mln
-2.92%
jan 1, 2004
5.474 bln
+1.077 bln
24.49%
jan 1, 2005
4.364 bln
-1.11 bln
-20.28%
jan 1, 2006
5.039 bln
+675.359 mln
15.48%
jan 1, 2007
5.516 bln
+476.591 mln
9.46%
jan 1, 2008
7.343 bln
+1.827 bln
33.12%
jan 1, 2009
9.413 bln
+2.07 bln
28.19%
jan 1, 2010
8.55 bln
-862.639 mln
-9.16%
jan 1, 2011
8.73 bln
+179.572 mln
2.1%
jan 1, 2012
9.893 bln
+1.163 bln
13.32%
jan 1, 2013
9.92 bln
+27.078 mln
0.27%
jan 1, 2014
10.602 bln
+681.911 mln
6.87%
jan 1, 2015
10.674 bln
+71.826 mln
0.68%
jan 1, 2016
9.739 bln
-934.864 mln
-8.76%
Ranking of countries by current statistics by years


Comments: