29
/
en
AIzaSyAYiBZKx7MnpbEhh9jyipgxe19OcubqV5w
April 1, 2024
267976
Tunisia
TUN
true
2
1
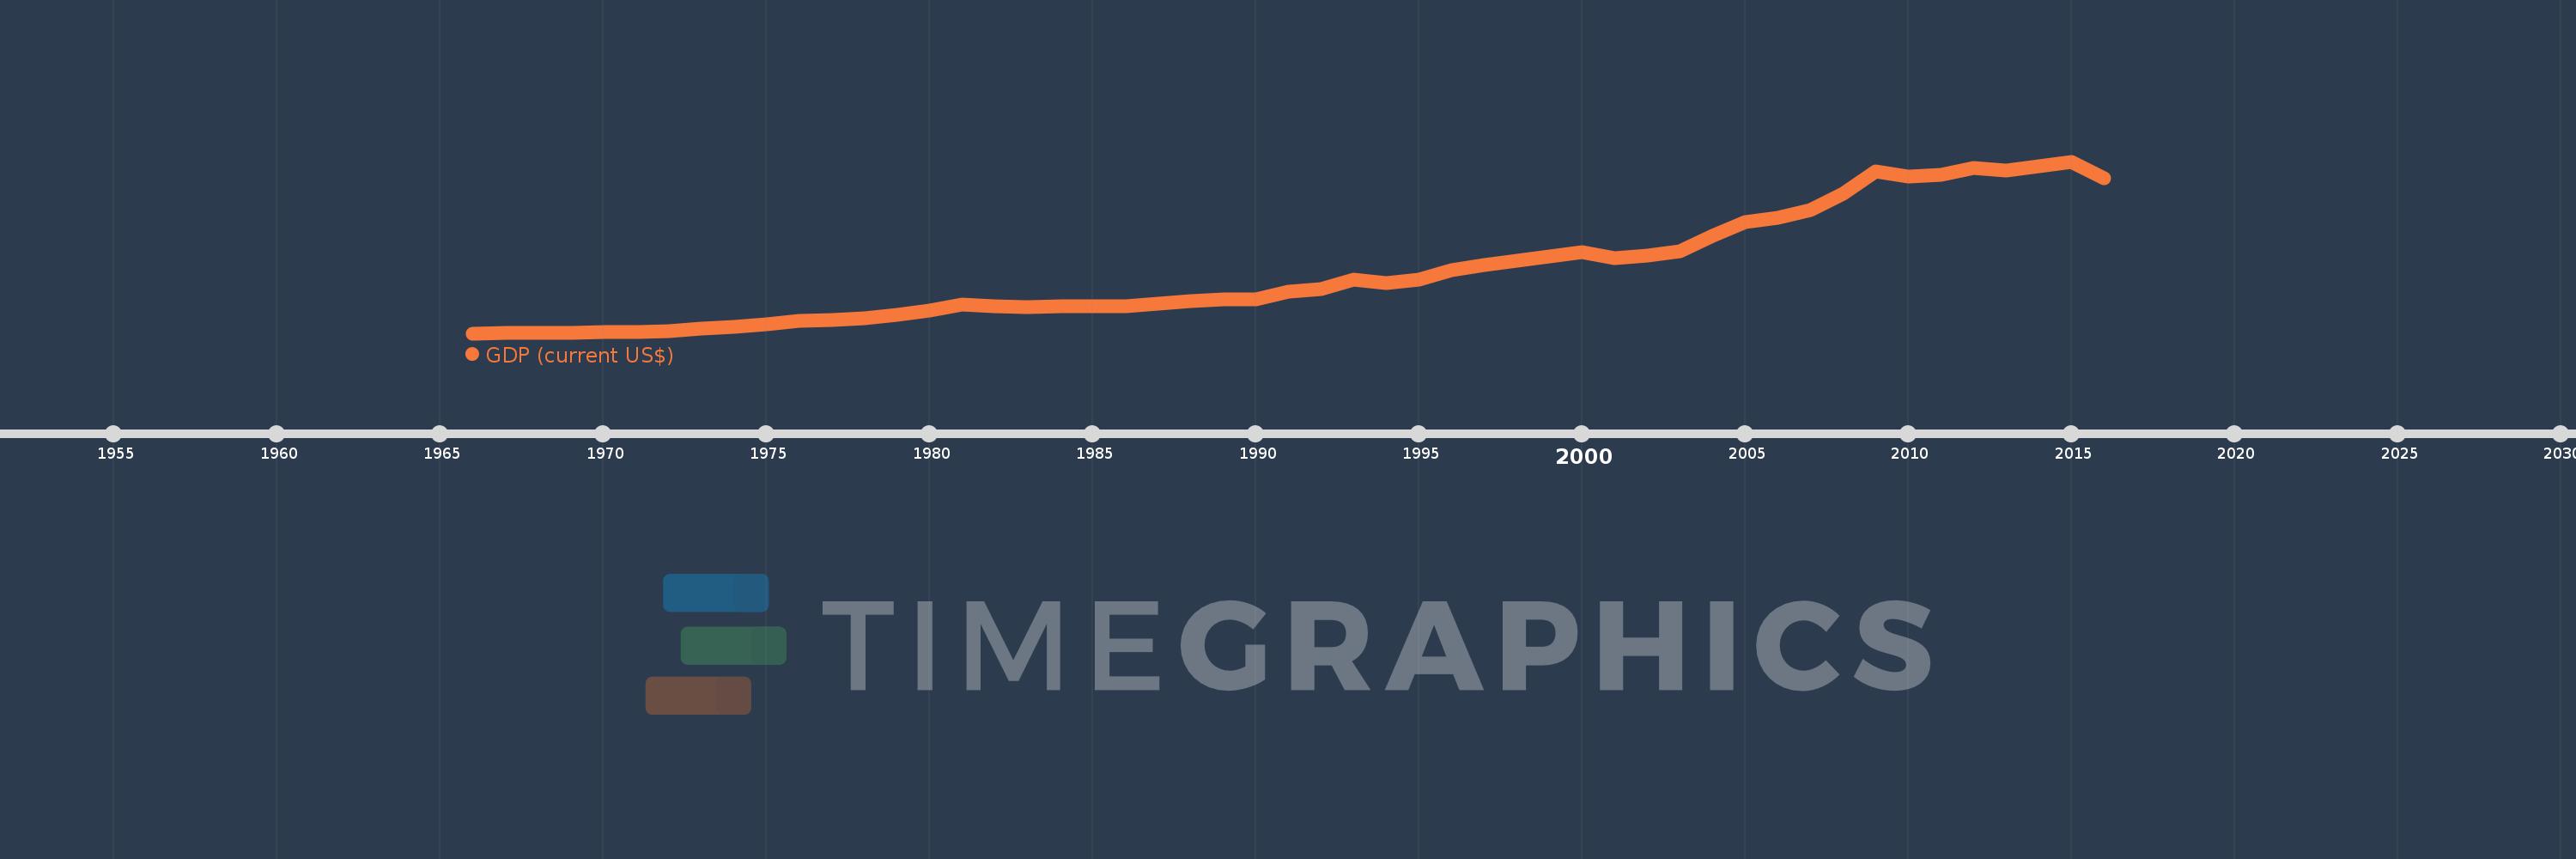
GDP (current US$)
2016,2015,2014,2013,2012,2011,2010,2009,2008,2007,2006,2005,2004,2003,2002,2001,2000,1999,1998,1997,1996,1995,1994,1993,1992,1991,1990,1989,1988,1987,1986,1985,1984,1983,1982,1981,1980,1979,1978,1977,1976,1975,1974,1973,1972,1971,1970,1969,1968,1967,1966
This statistics in other country:
AfghanistanAlbaniaAlgeriaAndorraAngolaAntigua and BarbudaArab WorldArgentinaArmeniaArubaAustraliaAustriaAzerbaijanBahamas, TheBahrainBangladeshBarbadosBelarusBelgiumBelizeBeninBermudaBhutanBoliviaBosnia and HerzegovinaBotswanaBrazilBrunei DarussalamBulgariaBurkina FasoBurundiCabo VerdeCambodiaCameroonCanadaCaribbean small statesCayman IslandsCentral African RepublicCentral Europe and the BalticsChadChannel IslandsChileChinaColombiaComorosCongo, Dem. Rep.Congo, Rep.Costa RicaCote d'IvoireCroatiaCubaCyprusCzech RepublicDenmarkDjiboutiDominicaDominican RepublicEarly-demographic dividendEast Asia & PacificEast Asia & Pacific (excluding high income)East Asia & Pacific (IDA & IBRD countries)EcuadorEgypt, Arab Rep.El SalvadorEquatorial GuineaEritreaEstoniaEthiopiaEuro areaEurope & Central AsiaEurope & Central Asia (excluding high income)Europe & Central Asia (IDA & IBRD countries)European UnionFaroe IslandsFijiFinlandFragile and conflict affected situationsFranceFrench PolynesiaGabonGambia, TheGeorgiaGermanyGhanaGreeceGreenlandGrenadaGuatemalaGuineaGuinea-BissauGuyanaHaitiHeavily indebted poor countries (HIPC)High incomeHondurasHong Kong SAR, ChinaHungaryIBRD onlyIcelandIDA & IBRD totalIDA blendIDA onlyIDA totalIndiaIndonesiaIran, Islamic Rep.IraqIrelandIsle of ManIsraelItalyJamaicaJapanJordanKazakhstanKenyaKiribatiKorea, Rep.KosovoKuwaitKyrgyz RepublicLao PDRLate-demographic dividendLatin America & Caribbean Latin America & Caribbean (excluding high income)Latin America & the Caribbean (IDA & IBRD countries)LatviaLeast developed countries: UN classificationLebanonLesothoLiberiaLibyaLiechtensteinLithuaniaLow & middle incomeLow incomeLower middle incomeLuxembourgMacao SAR, ChinaMacedonia, FYRMadagascarMalawiMalaysiaMaldivesMaliMaltaMarshall IslandsMauritaniaMauritiusMexicoMicronesia, Fed. Sts.Middle East & North AfricaMiddle East & North Africa (excluding high income)Middle East & North Africa (IDA & IBRD countries)Middle incomeMoldovaMonacoMongoliaMontenegroMoroccoMozambiqueMyanmarNamibiaNauruNepalNetherlandsNew CaledoniaNew ZealandNicaraguaNigerNigeriaNorth AmericaNorwayOECD membersOmanOther small statesPacific island small statesPakistanPalauPanamaPapua New GuineaParaguayPeruPhilippinesPolandPortugalPost-demographic dividendPre-demographic dividendPuerto RicoQatarRomaniaRussian FederationRwandaSamoaSan MarinoSao Tome and PrincipeSaudi ArabiaSenegalSerbiaSeychellesSierra LeoneSingaporeSlovak RepublicSloveniaSmall statesSolomon IslandsSomaliaSouth AfricaSouth AsiaSouth Asia (IDA & IBRD)South SudanSpainSri LankaSt. Kitts and NevisSt. LuciaSt. Vincent and the GrenadinesSub-Saharan Africa Sub-Saharan Africa (excluding high income)Sub-Saharan Africa (IDA & IBRD countries)SudanSurinameSwazilandSwedenSwitzerlandSyrian Arab RepublicTajikistanTanzaniaThailandTimor-LesteTogoTongaTrinidad and TobagoTunisiaTurkeyTurkmenistanTuvaluUgandaUkraineUnited Arab EmiratesUnited KingdomUnited StatesUpper middle incomeUruguayUzbekistanVanuatuVenezuela, RBVietnamVirgin Islands (U.S.)West Bank and GazaWorldYemen, Rep.ZambiaZimbabwe Timeline:
This timeline shows a graph from 1966 to 2016 of Tunisia. No data until 1965. Number of actual observations by date: 51.
Source name:
World Development Indicators
Source organization:
World Bank national accounts data, and OECD National Accounts data files.
Categories, topics:
Economy & Growth
Last updated:
apr 23, 2017
Indicators value changes by year
Minimum:
991.048 mln
jan 1, 1966
Maximum:
47.603 bln
jan 1, 2015
At the date of observation
Value
Absolute change
Change from previous value
jan 1, 1966
991.048 mln
+991.048 mln
0.0%
jan 1, 1967
1.041 bln
+49.905 mln
5.04%
jan 1, 1968
1.086 bln
+44.762 mln
4.3%
jan 1, 1969
1.215 bln
+128.952 mln
11.88%
jan 1, 1970
1.29 bln
+75.238 mln
6.19%
jan 1, 1971
1.439 bln
+149.333 mln
11.58%
jan 1, 1972
1.685 bln
+245.979 mln
17.09%
jan 1, 1973
2.237 bln
+552.259 mln
32.77%
jan 1, 1974
2.731 bln
+493.311 mln
22.05%
jan 1, 1975
3.546 bln
+815.146 mln
29.85%
jan 1, 1976
4.329 bln
+782.677 mln
22.07%
jan 1, 1977
4.508 bln
+179.319 mln
4.14%
jan 1, 1978
5.109 bln
+601.395 mln
13.34%
jan 1, 1979
5.968 bln
+858.72 mln
16.81%
jan 1, 1980
7.188 bln
+1.22 bln
20.44%
jan 1, 1981
8.744 bln
+1.556 bln
21.65%
jan 1, 1982
8.429 bln
-315.621 mln
-3.61%
jan 1, 1983
8.133 bln
-295.113 mln
-3.5%
jan 1, 1984
8.35 bln
+216.776 mln
2.67%
jan 1, 1985
8.255 bln
-95.285 mln
-1.14%
jan 1, 1986
8.41 bln
+155.294 mln
1.88%
jan 1, 1987
9.018 bln
+607.95 mln
7.23%
jan 1, 1988
9.696 bln
+678.135 mln
7.52%
jan 1, 1989
10.096 bln
+400.022 mln
4.13%
jan 1, 1990
10.102 bln
+5.782 mln
0.06%
jan 1, 1991
12.291 bln
+2.188 bln
21.66%
jan 1, 1992
13.075 bln
+784.214 mln
6.38%
jan 1, 1993
15.497 bln
+2.423 bln
18.53%
jan 1, 1994
14.609 bln
-888.339 mln
-5.73%
jan 1, 1995
15.632 bln
+1.024 bln
7.01%
jan 1, 1996
18.031 bln
+2.398 bln
15.34%
jan 1, 1997
19.587 bln
+1.556 bln
8.63%
jan 1, 1998
20.746 bln
+1.159 bln
5.92%
jan 1, 1999
21.803 bln
+1.057 bln
5.09%
jan 1, 2000
22.944 bln
+1.14 bln
5.23%
jan 1, 2001
21.473 bln
-1.47 bln
-6.41%
jan 1, 2002
22.066 bln
+592.912 mln
2.76%
jan 1, 2003
23.142 bln
+1.076 bln
4.88%
jan 1, 2004
27.453 bln
+4.311 bln
18.63%
jan 1, 2005
31.183 bln
+3.73 bln
13.59%
jan 1, 2006
32.273 bln
+1.09 bln
3.5%
jan 1, 2007
34.378 bln
+2.105 bln
6.52%
jan 1, 2008
38.908 bln
+4.53 bln
13.18%
jan 1, 2009
44.857 bln
+5.949 bln
15.29%
jan 1, 2010
43.455 bln
-1.402 bln
-3.12%
jan 1, 2011
44.051 bln
+595.993 mln
1.37%
jan 1, 2012
45.811 bln
+1.76 bln
3.99%
jan 1, 2013
45.044 bln
-766.45 mln
-1.67%
jan 1, 2014
46.256 bln
+1.211 bln
2.69%
jan 1, 2015
47.603 bln
+1.348 bln
2.91%
jan 1, 2016
43.015 bln
-4.588 bln
-9.64%
Ranking of countries by current statistics by years


Comments: