29
/
en
AIzaSyAYiBZKx7MnpbEhh9jyipgxe19OcubqV5w
April 1, 2024
219571
Papua New Guinea
PNG
true
2
1
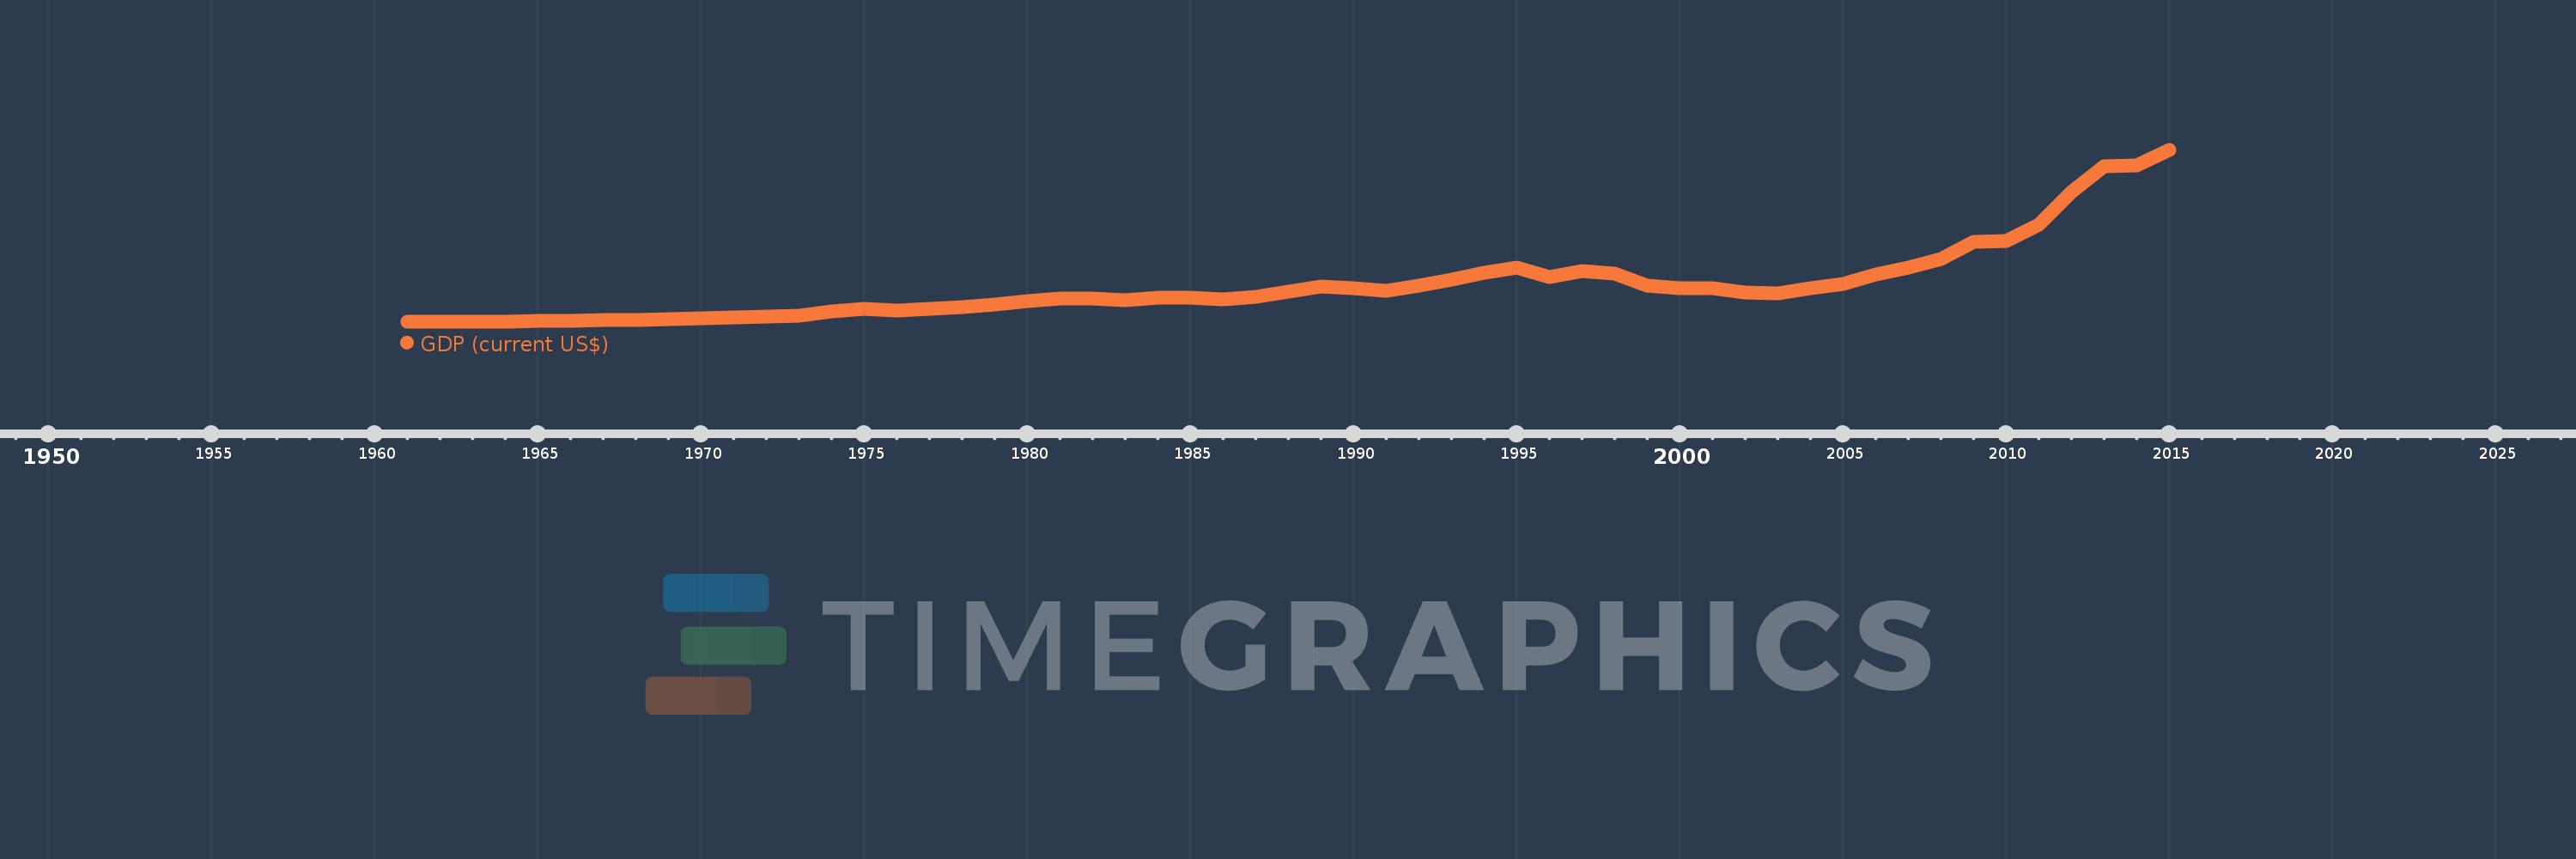
GDP (current US$)
2015,2014,2013,2012,2011,2010,2009,2008,2007,2006,2005,2004,2003,2002,2001,2000,1999,1998,1997,1996,1995,1994,1993,1992,1991,1990,1989,1988,1987,1986,1985,1984,1983,1982,1981,1980,1979,1978,1977,1976,1975,1974,1973,1972,1971,1970,1969,1968,1967,1966,1965,1964,1963,1962,1961
This statistics in other country:
AfghanistanAlbaniaAlgeriaAndorraAngolaAntigua and BarbudaArab WorldArgentinaArmeniaArubaAustraliaAustriaAzerbaijanBahamas, TheBahrainBangladeshBarbadosBelarusBelgiumBelizeBeninBermudaBhutanBoliviaBosnia and HerzegovinaBotswanaBrazilBrunei DarussalamBulgariaBurkina FasoBurundiCabo VerdeCambodiaCameroonCanadaCaribbean small statesCayman IslandsCentral African RepublicCentral Europe and the BalticsChadChannel IslandsChileChinaColombiaComorosCongo, Dem. Rep.Congo, Rep.Costa RicaCote d'IvoireCroatiaCubaCyprusCzech RepublicDenmarkDjiboutiDominicaDominican RepublicEarly-demographic dividendEast Asia & PacificEast Asia & Pacific (excluding high income)East Asia & Pacific (IDA & IBRD countries)EcuadorEgypt, Arab Rep.El SalvadorEquatorial GuineaEritreaEstoniaEthiopiaEuro areaEurope & Central AsiaEurope & Central Asia (excluding high income)Europe & Central Asia (IDA & IBRD countries)European UnionFaroe IslandsFijiFinlandFragile and conflict affected situationsFranceFrench PolynesiaGabonGambia, TheGeorgiaGermanyGhanaGreeceGreenlandGrenadaGuatemalaGuineaGuinea-BissauGuyanaHaitiHeavily indebted poor countries (HIPC)High incomeHondurasHong Kong SAR, ChinaHungaryIBRD onlyIcelandIDA & IBRD totalIDA blendIDA onlyIDA totalIndiaIndonesiaIran, Islamic Rep.IraqIrelandIsle of ManIsraelItalyJamaicaJapanJordanKazakhstanKenyaKiribatiKorea, Rep.KosovoKuwaitKyrgyz RepublicLao PDRLate-demographic dividendLatin America & Caribbean Latin America & Caribbean (excluding high income)Latin America & the Caribbean (IDA & IBRD countries)LatviaLeast developed countries: UN classificationLebanonLesothoLiberiaLibyaLiechtensteinLithuaniaLow & middle incomeLow incomeLower middle incomeLuxembourgMacao SAR, ChinaMacedonia, FYRMadagascarMalawiMalaysiaMaldivesMaliMaltaMarshall IslandsMauritaniaMauritiusMexicoMicronesia, Fed. Sts.Middle East & North AfricaMiddle East & North Africa (excluding high income)Middle East & North Africa (IDA & IBRD countries)Middle incomeMoldovaMonacoMongoliaMontenegroMoroccoMozambiqueMyanmarNamibiaNauruNepalNetherlandsNew CaledoniaNew ZealandNicaraguaNigerNigeriaNorth AmericaNorwayOECD membersOmanOther small statesPacific island small statesPakistanPalauPanamaPapua New GuineaParaguayPeruPhilippinesPolandPortugalPost-demographic dividendPre-demographic dividendPuerto RicoQatarRomaniaRussian FederationRwandaSamoaSan MarinoSao Tome and PrincipeSaudi ArabiaSenegalSerbiaSeychellesSierra LeoneSingaporeSlovak RepublicSloveniaSmall statesSolomon IslandsSomaliaSouth AfricaSouth AsiaSouth Asia (IDA & IBRD)South SudanSpainSri LankaSt. Kitts and NevisSt. LuciaSt. Vincent and the GrenadinesSub-Saharan Africa Sub-Saharan Africa (excluding high income)Sub-Saharan Africa (IDA & IBRD countries)SudanSurinameSwazilandSwedenSwitzerlandSyrian Arab RepublicTajikistanTanzaniaThailandTimor-LesteTogoTongaTrinidad and TobagoTunisiaTurkeyTurkmenistanTuvaluUgandaUkraineUnited Arab EmiratesUnited KingdomUnited StatesUpper middle incomeUruguayUzbekistanVanuatuVenezuela, RBVietnamVirgin Islands (U.S.)West Bank and GazaWorldYemen, Rep.ZambiaZimbabwe Timeline:
This timeline shows a graph from 1961 to 2015 of Papua New Guinea. No data until 1960. Number of actual observations by date: 55.
Source name:
World Development Indicators
Source organization:
World Bank national accounts data, and OECD National Accounts data files.
Categories, topics:
Economy & Growth
Last updated:
apr 23, 2017
Indicators value changes by year
Minimum:
230.496 mln
jan 1, 1961
Maximum:
16.929 bln
jan 1, 2015
At the date of observation
Value
Absolute change
Change from previous value
jan 1, 1961
230.496 mln
+230.496 mln
0.0%
jan 1, 1962
244.832 mln
+14.336 mln
6.22%
jan 1, 1963
261.184 mln
+16.352 mln
6.68%
jan 1, 1964
275.968 mln
+14.784 mln
5.66%
jan 1, 1965
305.312 mln
+29.344 mln
10.63%
jan 1, 1966
344.159 mln
+38.847 mln
12.72%
jan 1, 1967
390.973 mln
+46.814 mln
13.6%
jan 1, 1968
441.707 mln
+50.734 mln
12.98%
jan 1, 1969
485.161 mln
+43.454 mln
9.84%
jan 1, 1970
551.237 mln
+66.076 mln
13.62%
jan 1, 1971
645.537 mln
+94.3 mln
17.11%
jan 1, 1972
717.716 mln
+72.179 mln
11.18%
jan 1, 1973
858.802 mln
+141.086 mln
19.66%
jan 1, 1974
1.299 bln
+440.303 mln
51.27%
jan 1, 1975
1.467 bln
+168.241 mln
12.95%
jan 1, 1976
1.357 bln
-110.755 mln
-7.55%
jan 1, 1977
1.512 bln
+155.265 mln
11.45%
jan 1, 1978
1.641 bln
+128.907 mln
8.53%
jan 1, 1979
1.948 bln
+307.184 mln
18.72%
jan 1, 1980
2.294 bln
+345.674 mln
17.75%
jan 1, 1981
2.546 bln
+252.361 mln
11.0%
jan 1, 1982
2.498 bln
-47.915 mln
-1.88%
jan 1, 1983
2.369 bln
-129.483 mln
-5.18%
jan 1, 1984
2.562 bln
+193.908 mln
8.19%
jan 1, 1985
2.553 bln
-9.966 mln
-0.39%
jan 1, 1986
2.423 bln
-129.153 mln
-5.06%
jan 1, 1987
2.648 bln
+224.661 mln
9.27%
jan 1, 1988
3.144 bln
+495.815 mln
18.72%
jan 1, 1989
3.656 bln
+512.131 mln
16.29%
jan 1, 1990
3.546 bln
-109.52 mln
-3.0%
jan 1, 1991
3.22 bln
-326.73 mln
-9.21%
jan 1, 1992
3.787 bln
+567.622 mln
17.63%
jan 1, 1993
4.378 bln
+590.632 mln
15.59%
jan 1, 1994
4.975 bln
+596.679 mln
13.63%
jan 1, 1995
5.503 bln
+527.986 mln
10.61%
jan 1, 1996
4.636 bln
-866.535 mln
-15.75%
jan 1, 1997
5.155 bln
+519.372 mln
11.2%
jan 1, 1998
4.937 bln
-218.88 mln
-4.25%
jan 1, 1999
3.789 bln
-1.147 bln
-23.24%
jan 1, 2000
3.477 bln
-312.368 mln
-8.24%
jan 1, 2001
3.521 bln
+44.288 mln
1.27%
jan 1, 2002
3.081 bln
-440.318 mln
-12.5%
jan 1, 2003
3.0 bln
-81.487 mln
-2.64%
jan 1, 2004
3.536 bln
+536.917 mln
17.9%
jan 1, 2005
3.927 bln
+390.655 mln
11.05%
jan 1, 2006
4.866 bln
+938.857 mln
23.91%
jan 1, 2007
5.528 bln
+661.885 mln
13.6%
jan 1, 2008
6.341 bln
+812.817 mln
14.7%
jan 1, 2009
8.0 bln
+1.659 bln
26.17%
jan 1, 2010
8.105 bln
+105.258 mln
1.32%
jan 1, 2011
9.716 bln
+1.611 bln
19.87%
jan 1, 2012
12.873 bln
+3.157 bln
32.49%
jan 1, 2013
15.392 bln
+2.519 bln
19.56%
jan 1, 2014
15.413 bln
+21.534 mln
0.14%
jan 1, 2015
16.929 bln
+1.516 bln
9.83%
Ranking of countries by current statistics by years


Comments: