29
/
en
AIzaSyAYiBZKx7MnpbEhh9jyipgxe19OcubqV5w
April 1, 2024
220827
Paraguay
PRY
true
2
1
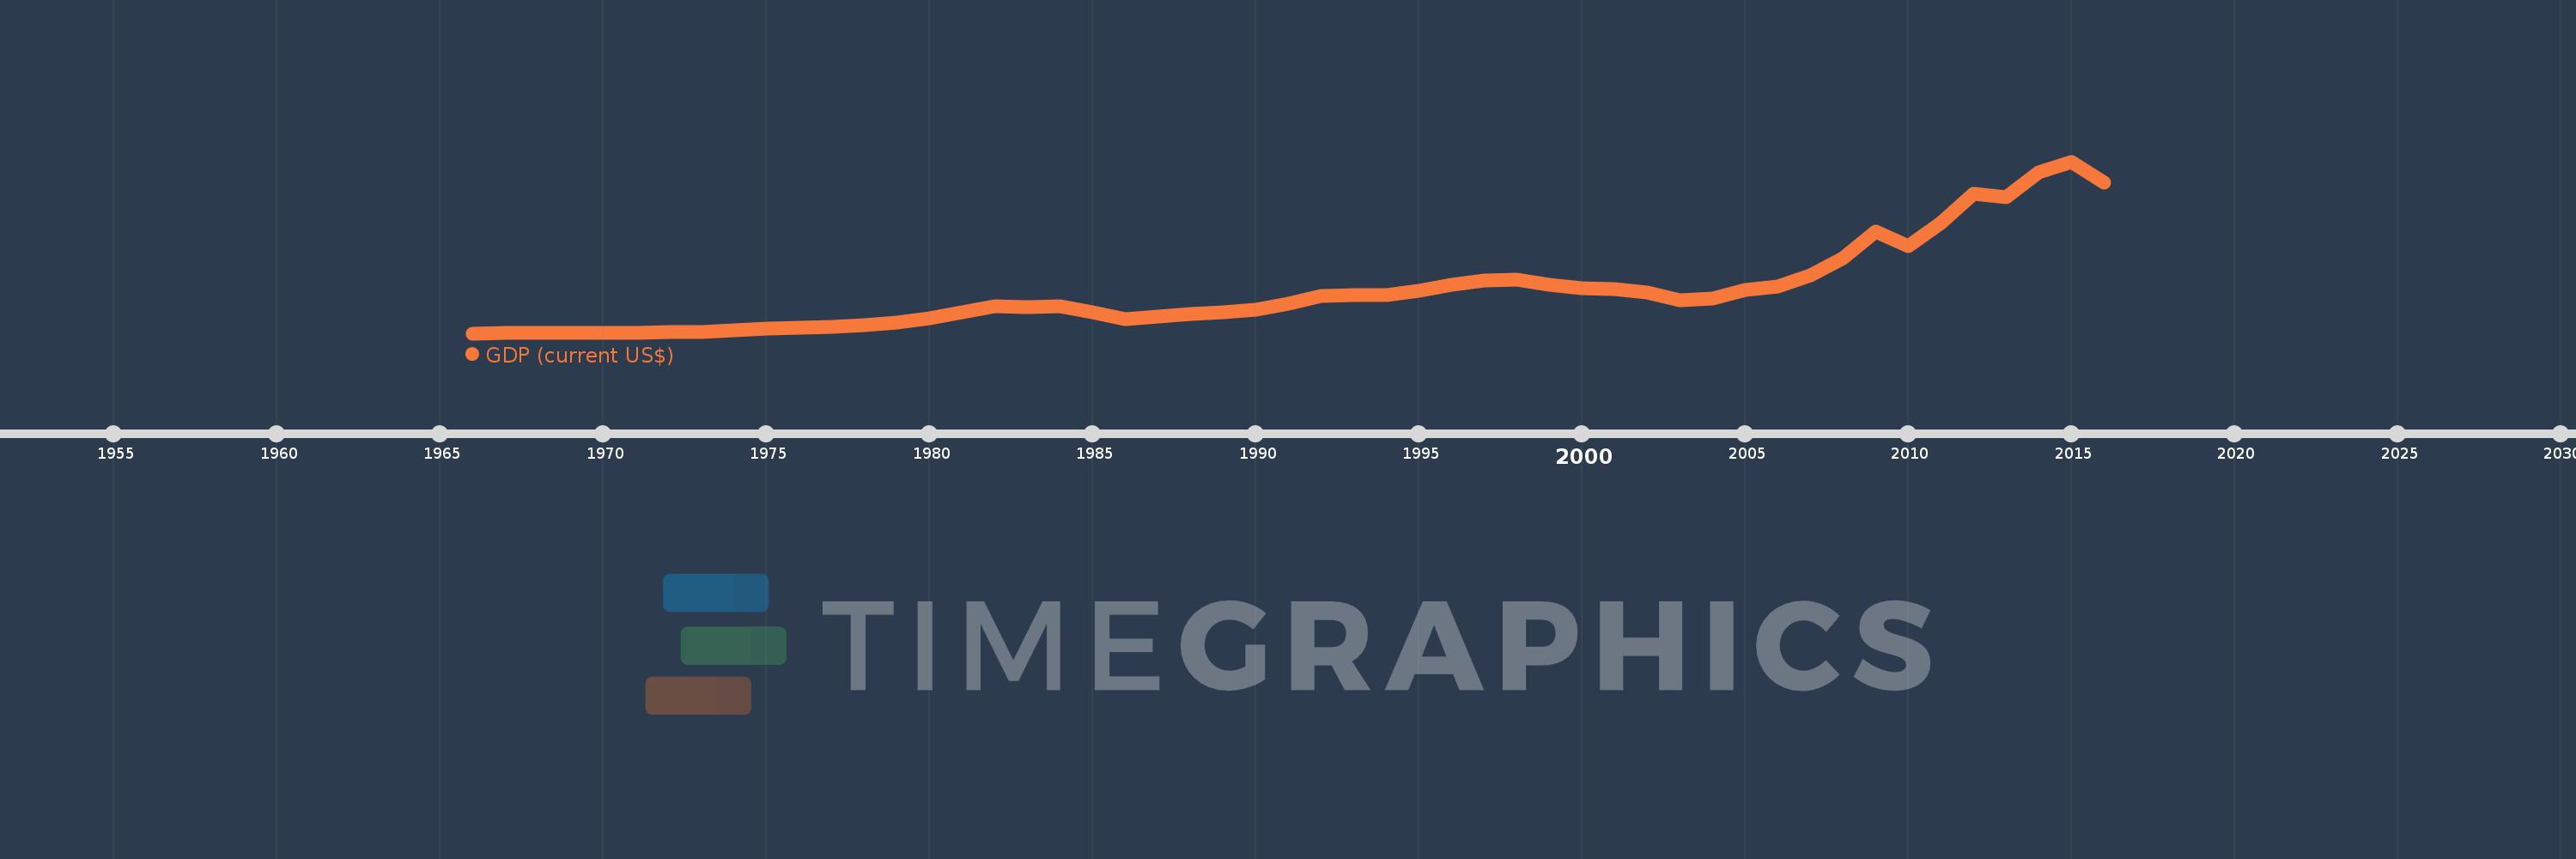
GDP (current US$)
2016,2015,2014,2013,2012,2011,2010,2009,2008,2007,2006,2005,2004,2003,2002,2001,2000,1999,1998,1997,1996,1995,1994,1993,1992,1991,1990,1989,1988,1987,1986,1985,1984,1983,1982,1981,1980,1979,1978,1977,1976,1975,1974,1973,1972,1971,1970,1969,1968,1967,1966
This statistics in other country:
AfghanistanAlbaniaAlgeriaAndorraAngolaAntigua and BarbudaArab WorldArgentinaArmeniaArubaAustraliaAustriaAzerbaijanBahamas, TheBahrainBangladeshBarbadosBelarusBelgiumBelizeBeninBermudaBhutanBoliviaBosnia and HerzegovinaBotswanaBrazilBrunei DarussalamBulgariaBurkina FasoBurundiCabo VerdeCambodiaCameroonCanadaCaribbean small statesCayman IslandsCentral African RepublicCentral Europe and the BalticsChadChannel IslandsChileChinaColombiaComorosCongo, Dem. Rep.Congo, Rep.Costa RicaCote d'IvoireCroatiaCubaCyprusCzech RepublicDenmarkDjiboutiDominicaDominican RepublicEarly-demographic dividendEast Asia & PacificEast Asia & Pacific (excluding high income)East Asia & Pacific (IDA & IBRD countries)EcuadorEgypt, Arab Rep.El SalvadorEquatorial GuineaEritreaEstoniaEthiopiaEuro areaEurope & Central AsiaEurope & Central Asia (excluding high income)Europe & Central Asia (IDA & IBRD countries)European UnionFaroe IslandsFijiFinlandFragile and conflict affected situationsFranceFrench PolynesiaGabonGambia, TheGeorgiaGermanyGhanaGreeceGreenlandGrenadaGuatemalaGuineaGuinea-BissauGuyanaHaitiHeavily indebted poor countries (HIPC)High incomeHondurasHong Kong SAR, ChinaHungaryIBRD onlyIcelandIDA & IBRD totalIDA blendIDA onlyIDA totalIndiaIndonesiaIran, Islamic Rep.IraqIrelandIsle of ManIsraelItalyJamaicaJapanJordanKazakhstanKenyaKiribatiKorea, Rep.KosovoKuwaitKyrgyz RepublicLao PDRLate-demographic dividendLatin America & Caribbean Latin America & Caribbean (excluding high income)Latin America & the Caribbean (IDA & IBRD countries)LatviaLeast developed countries: UN classificationLebanonLesothoLiberiaLibyaLiechtensteinLithuaniaLow & middle incomeLow incomeLower middle incomeLuxembourgMacao SAR, ChinaMacedonia, FYRMadagascarMalawiMalaysiaMaldivesMaliMaltaMarshall IslandsMauritaniaMauritiusMexicoMicronesia, Fed. Sts.Middle East & North AfricaMiddle East & North Africa (excluding high income)Middle East & North Africa (IDA & IBRD countries)Middle incomeMoldovaMonacoMongoliaMontenegroMoroccoMozambiqueMyanmarNamibiaNauruNepalNetherlandsNew CaledoniaNew ZealandNicaraguaNigerNigeriaNorth AmericaNorwayOECD membersOmanOther small statesPacific island small statesPakistanPalauPanamaPapua New GuineaParaguayPeruPhilippinesPolandPortugalPost-demographic dividendPre-demographic dividendPuerto RicoQatarRomaniaRussian FederationRwandaSamoaSan MarinoSao Tome and PrincipeSaudi ArabiaSenegalSerbiaSeychellesSierra LeoneSingaporeSlovak RepublicSloveniaSmall statesSolomon IslandsSomaliaSouth AfricaSouth AsiaSouth Asia (IDA & IBRD)South SudanSpainSri LankaSt. Kitts and NevisSt. LuciaSt. Vincent and the GrenadinesSub-Saharan Africa Sub-Saharan Africa (excluding high income)Sub-Saharan Africa (IDA & IBRD countries)SudanSurinameSwazilandSwedenSwitzerlandSyrian Arab RepublicTajikistanTanzaniaThailandTimor-LesteTogoTongaTrinidad and TobagoTunisiaTurkeyTurkmenistanTuvaluUgandaUkraineUnited Arab EmiratesUnited KingdomUnited StatesUpper middle incomeUruguayUzbekistanVanuatuVenezuela, RBVietnamVirgin Islands (U.S.)West Bank and GazaWorldYemen, Rep.ZambiaZimbabwe Timeline:
This timeline shows a graph from 1966 to 2016 of Paraguay. No data until 1965. Number of actual observations by date: 51.
Source name:
World Development Indicators
Source organization:
World Bank national accounts data, and OECD National Accounts data files.
Categories, topics:
Economy & Growth
Last updated:
apr 23, 2017
Indicators value changes by year
Minimum:
400.13 mln
jan 1, 1966
Maximum:
30.881 bln
jan 1, 2015
At the date of observation
Value
Absolute change
Change from previous value
jan 1, 1966
400.13 mln
+400.13 mln
0.0%
jan 1, 1967
421.7 mln
+21.571 mln
5.39%
jan 1, 1968
451.524 mln
+29.824 mln
7.07%
jan 1, 1969
477.013 mln
+25.488 mln
5.64%
jan 1, 1970
512.729 mln
+35.716 mln
7.49%
jan 1, 1971
548.758 mln
+36.029 mln
7.03%
jan 1, 1972
609.047 mln
+60.289 mln
10.99%
jan 1, 1973
697.292 mln
+88.244 mln
14.49%
jan 1, 1974
889.357 mln
+192.065 mln
27.54%
jan 1, 1975
1.2 bln
+310.262 mln
34.89%
jan 1, 1976
1.352 bln
+152.27 mln
12.69%
jan 1, 1977
1.541 bln
+188.931 mln
13.98%
jan 1, 1978
1.912 bln
+371.533 mln
24.11%
jan 1, 1979
2.35 bln
+437.976 mln
22.9%
jan 1, 1980
3.135 bln
+784.795 mln
33.39%
jan 1, 1981
4.095 bln
+959.687 mln
30.61%
jan 1, 1982
5.22 bln
+1.125 bln
27.47%
jan 1, 1983
5.067 bln
-152.067 mln
-2.91%
jan 1, 1984
5.237 bln
+169.983 mln
3.35%
jan 1, 1985
4.067 bln
-1.17 bln
-22.34%
jan 1, 1986
2.966 bln
-1.101 bln
-27.07%
jan 1, 1987
3.44 bln
+473.482 mln
15.96%
jan 1, 1988
3.778 bln
+338.6 mln
9.84%
jan 1, 1989
4.083 bln
+304.31 mln
8.05%
jan 1, 1990
4.6 bln
+517.345 mln
12.67%
jan 1, 1991
5.695 bln
+1.095 bln
23.81%
jan 1, 1992
6.984 bln
+1.289 bln
22.64%
jan 1, 1993
7.157 bln
+173.056 mln
2.48%
jan 1, 1994
7.25 bln
+92.11 mln
1.29%
jan 1, 1995
7.871 bln
+621.449 mln
8.57%
jan 1, 1996
9.062 bln
+1.191 bln
15.13%
jan 1, 1997
9.788 bln
+726.26 mln
8.01%
jan 1, 1998
9.965 bln
+176.834 mln
1.81%
jan 1, 1999
9.025 bln
-940.658 mln
-9.44%
jan 1, 2000
8.393 bln
-632.018 mln
-7.0%
jan 1, 2001
8.196 bln
-196.556 mln
-2.34%
jan 1, 2002
7.663 bln
-533.398 mln
-6.51%
jan 1, 2003
6.325 bln
-1.337 bln
-17.45%
jan 1, 2004
6.588 bln
+262.952 mln
4.16%
jan 1, 2005
8.034 bln
+1.446 bln
21.95%
jan 1, 2006
8.735 bln
+700.776 mln
8.72%
jan 1, 2007
10.646 bln
+1.912 bln
21.88%
jan 1, 2008
13.795 bln
+3.149 bln
29.58%
jan 1, 2009
18.504 bln
+4.709 bln
34.14%
jan 1, 2010
15.93 bln
-2.574 bln
-13.91%
jan 1, 2011
20.031 bln
+4.101 bln
25.74%
jan 1, 2012
25.1 bln
+5.069 bln
25.31%
jan 1, 2013
24.595 bln
-504.362 mln
-2.01%
jan 1, 2014
28.966 bln
+4.371 bln
17.77%
jan 1, 2015
30.881 bln
+1.915 bln
6.61%
jan 1, 2016
27.094 bln
-3.787 bln
-12.26%
Ranking of countries by current statistics by years


Comments: