29
/
en
AIzaSyAYiBZKx7MnpbEhh9jyipgxe19OcubqV5w
April 1, 2024
164834
Jordan
JOR
true
2
1
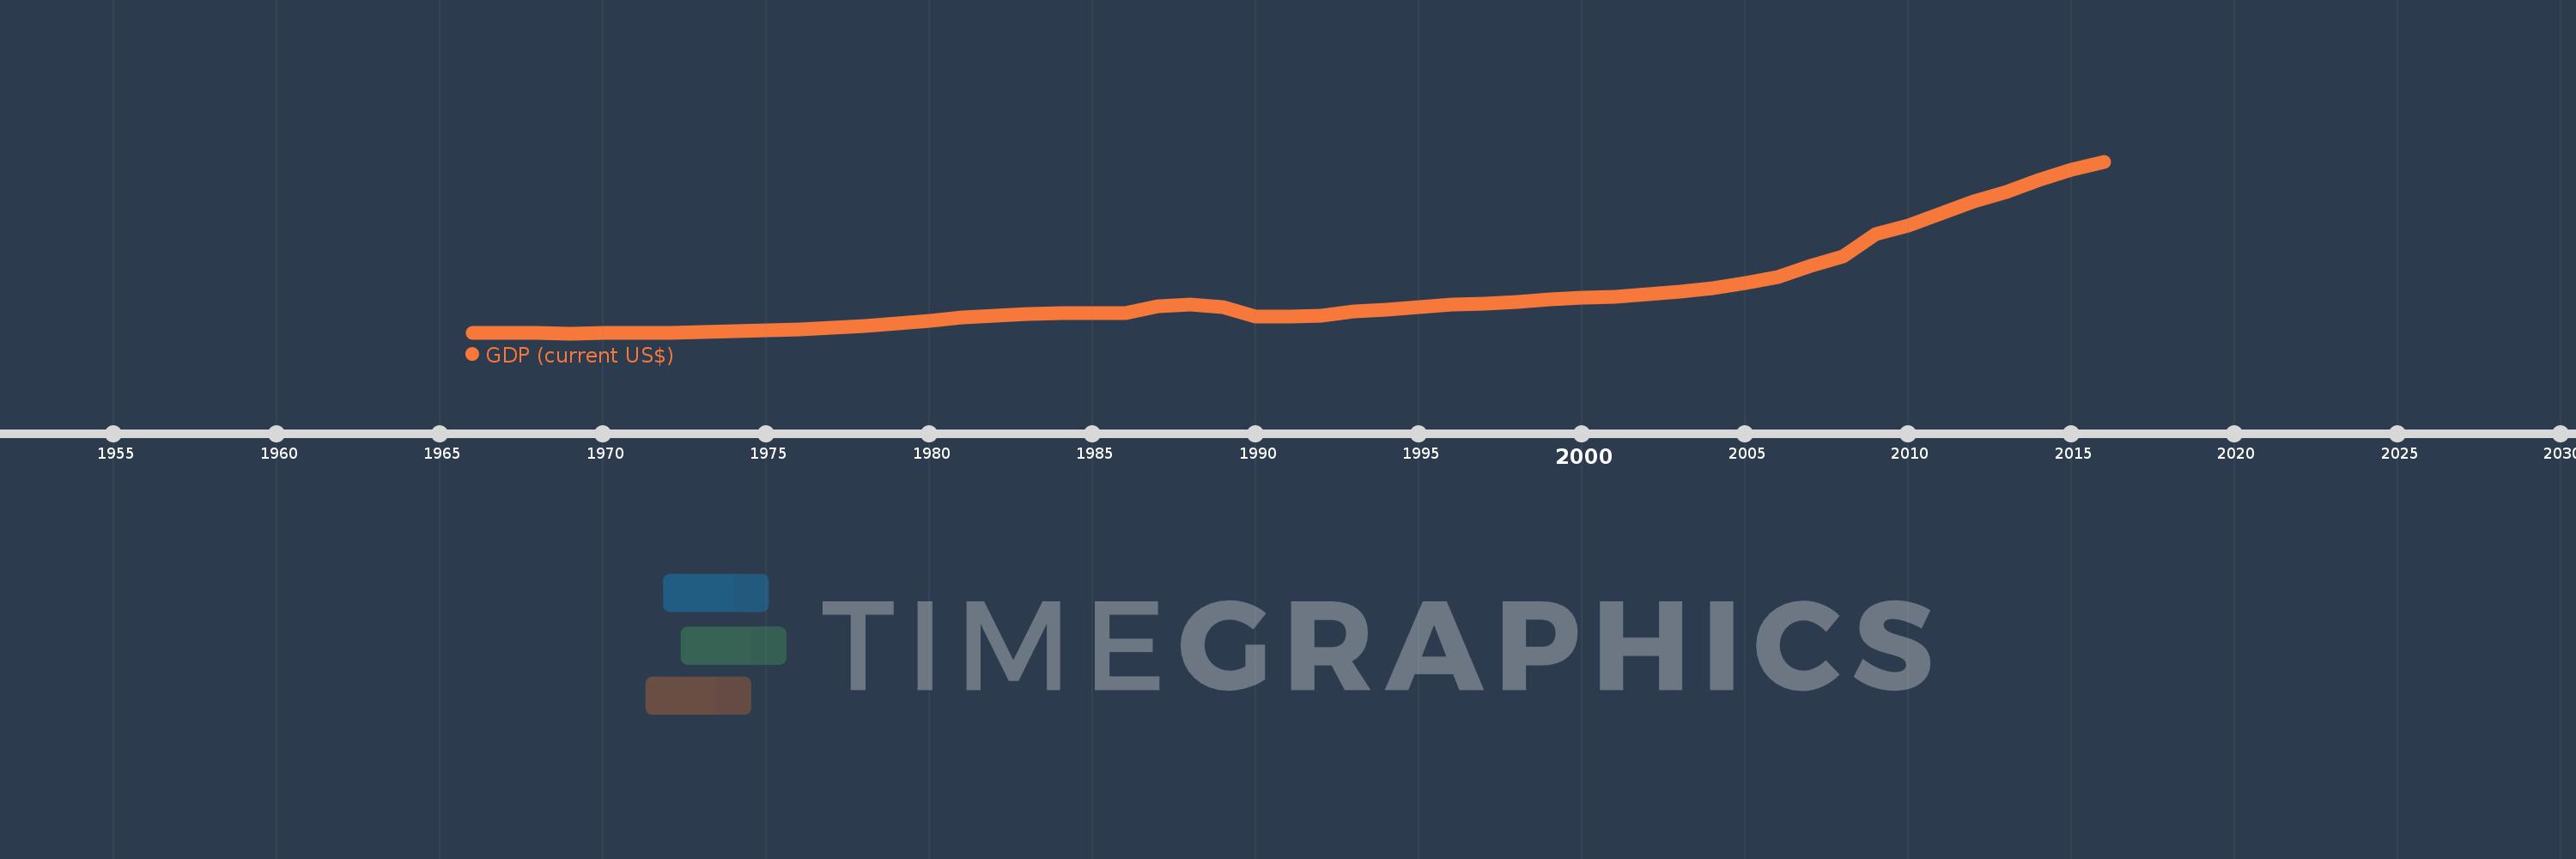
GDP (current US$)
2016,2015,2014,2013,2012,2011,2010,2009,2008,2007,2006,2005,2004,2003,2002,2001,2000,1999,1998,1997,1996,1995,1994,1993,1992,1991,1990,1989,1988,1987,1986,1985,1984,1983,1982,1981,1980,1979,1978,1977,1976,1975,1974,1973,1972,1971,1970,1969,1968,1967,1966
This statistics in other country:
AfghanistanAlbaniaAlgeriaAndorraAngolaAntigua and BarbudaArab WorldArgentinaArmeniaArubaAustraliaAustriaAzerbaijanBahamas, TheBahrainBangladeshBarbadosBelarusBelgiumBelizeBeninBermudaBhutanBoliviaBosnia and HerzegovinaBotswanaBrazilBrunei DarussalamBulgariaBurkina FasoBurundiCabo VerdeCambodiaCameroonCanadaCaribbean small statesCayman IslandsCentral African RepublicCentral Europe and the BalticsChadChannel IslandsChileChinaColombiaComorosCongo, Dem. Rep.Congo, Rep.Costa RicaCote d'IvoireCroatiaCubaCyprusCzech RepublicDenmarkDjiboutiDominicaDominican RepublicEarly-demographic dividendEast Asia & PacificEast Asia & Pacific (excluding high income)East Asia & Pacific (IDA & IBRD countries)EcuadorEgypt, Arab Rep.El SalvadorEquatorial GuineaEritreaEstoniaEthiopiaEuro areaEurope & Central AsiaEurope & Central Asia (excluding high income)Europe & Central Asia (IDA & IBRD countries)European UnionFaroe IslandsFijiFinlandFragile and conflict affected situationsFranceFrench PolynesiaGabonGambia, TheGeorgiaGermanyGhanaGreeceGreenlandGrenadaGuatemalaGuineaGuinea-BissauGuyanaHaitiHeavily indebted poor countries (HIPC)High incomeHondurasHong Kong SAR, ChinaHungaryIBRD onlyIcelandIDA & IBRD totalIDA blendIDA onlyIDA totalIndiaIndonesiaIran, Islamic Rep.IraqIrelandIsle of ManIsraelItalyJamaicaJapanJordanKazakhstanKenyaKiribatiKorea, Rep.KosovoKuwaitKyrgyz RepublicLao PDRLate-demographic dividendLatin America & Caribbean Latin America & Caribbean (excluding high income)Latin America & the Caribbean (IDA & IBRD countries)LatviaLeast developed countries: UN classificationLebanonLesothoLiberiaLibyaLiechtensteinLithuaniaLow & middle incomeLow incomeLower middle incomeLuxembourgMacao SAR, ChinaMacedonia, FYRMadagascarMalawiMalaysiaMaldivesMaliMaltaMarshall IslandsMauritaniaMauritiusMexicoMicronesia, Fed. Sts.Middle East & North AfricaMiddle East & North Africa (excluding high income)Middle East & North Africa (IDA & IBRD countries)Middle incomeMoldovaMonacoMongoliaMontenegroMoroccoMozambiqueMyanmarNamibiaNauruNepalNetherlandsNew CaledoniaNew ZealandNicaraguaNigerNigeriaNorth AmericaNorwayOECD membersOmanOther small statesPacific island small statesPakistanPalauPanamaPapua New GuineaParaguayPeruPhilippinesPolandPortugalPost-demographic dividendPre-demographic dividendPuerto RicoQatarRomaniaRussian FederationRwandaSamoaSan MarinoSao Tome and PrincipeSaudi ArabiaSenegalSerbiaSeychellesSierra LeoneSingaporeSlovak RepublicSloveniaSmall statesSolomon IslandsSomaliaSouth AfricaSouth AsiaSouth Asia (IDA & IBRD)South SudanSpainSri LankaSt. Kitts and NevisSt. LuciaSt. Vincent and the GrenadinesSub-Saharan Africa Sub-Saharan Africa (excluding high income)Sub-Saharan Africa (IDA & IBRD countries)SudanSurinameSwazilandSwedenSwitzerlandSyrian Arab RepublicTajikistanTanzaniaThailandTimor-LesteTogoTongaTrinidad and TobagoTunisiaTurkeyTurkmenistanTuvaluUgandaUkraineUnited Arab EmiratesUnited KingdomUnited StatesUpper middle incomeUruguayUzbekistanVanuatuVenezuela, RBVietnamVirgin Islands (U.S.)West Bank and GazaWorldYemen, Rep.ZambiaZimbabwe Timeline:
This timeline shows a graph from 1966 to 2016 of Jordan. No data until 1965. Number of actual observations by date: 51.
Source name:
World Development Indicators
Source organization:
World Bank national accounts data, and OECD National Accounts data files.
Categories, topics:
Economy & Growth
Last updated:
apr 23, 2017
Indicators value changes by year
Minimum:
561.187 mln
jan 1, 1969
Maximum:
37.517 bln
jan 1, 2016
At the date of observation
Value
Absolute change
Change from previous value
jan 1, 1966
599.832 mln
+599.832 mln
0.0%
jan 1, 1967
658.079 mln
+58.247 mln
9.71%
jan 1, 1968
631.756 mln
-26.323 mln
-4.0%
jan 1, 1969
561.187 mln
-70.568 mln
-11.17%
jan 1, 1970
698.964 mln
+137.777 mln
24.55%
jan 1, 1971
639.597 mln
-59.367 mln
-8.49%
jan 1, 1972
678.241 mln
+38.645 mln
6.04%
jan 1, 1973
788.575 mln
+110.333 mln
16.27%
jan 1, 1974
943.701 mln
+155.126 mln
19.67%
jan 1, 1975
1.197 bln
+253.754 mln
26.89%
jan 1, 1976
1.363 bln
+165.585 mln
13.83%
jan 1, 1977
1.709 bln
+345.696 mln
25.36%
jan 1, 1978
2.097 bln
+387.834 mln
22.7%
jan 1, 1979
2.603 bln
+506.18 mln
24.14%
jan 1, 1980
3.272 bln
+668.98 mln
25.7%
jan 1, 1981
3.91 bln
+638.309 mln
19.51%
jan 1, 1982
4.385 bln
+474.648 mln
12.14%
jan 1, 1983
4.681 bln
+295.882 mln
6.75%
jan 1, 1984
4.92 bln
+239.84 mln
5.12%
jan 1, 1985
4.967 bln
+46.302 mln
0.94%
jan 1, 1986
4.994 bln
+27.119 mln
0.55%
jan 1, 1987
6.401 bln
+1.408 bln
28.19%
jan 1, 1988
6.756 bln
+354.219 mln
5.53%
jan 1, 1989
6.277 bln
-478.402 mln
-7.08%
jan 1, 1990
4.221 bln
-2.056 bln
-32.76%
jan 1, 1991
4.16 bln
-60.941 mln
-1.44%
jan 1, 1992
4.344 bln
+184.246 mln
4.43%
jan 1, 1993
5.311 bln
+967.079 mln
22.26%
jan 1, 1994
5.606 bln
+294.512 mln
5.54%
jan 1, 1995
6.238 bln
+631.898 mln
11.27%
jan 1, 1996
6.727 bln
+489.707 mln
7.85%
jan 1, 1997
6.928 bln
+200.913 mln
2.99%
jan 1, 1998
7.244 bln
+316.044 mln
4.56%
jan 1, 1999
7.911 bln
+666.218 mln
9.2%
jan 1, 2000
8.147 bln
+236.873 mln
2.99%
jan 1, 2001
8.458 bln
+310.429 mln
3.81%
jan 1, 2002
8.973 bln
+515.278 mln
6.09%
jan 1, 2003
9.58 bln
+607.213 mln
6.77%
jan 1, 2004
10.193 bln
+612.878 mln
6.4%
jan 1, 2005
11.408 bln
+1.214 bln
11.91%
jan 1, 2006
12.589 bln
+1.181 bln
10.35%
jan 1, 2007
15.057 bln
+2.468 bln
19.61%
jan 1, 2008
17.111 bln
+2.054 bln
13.64%
jan 1, 2009
21.972 bln
+4.861 bln
28.41%
jan 1, 2010
23.818 bln
+1.846 bln
8.4%
jan 1, 2011
26.425 bln
+2.607 bln
10.95%
jan 1, 2012
28.84 bln
+2.415 bln
9.14%
jan 1, 2013
30.937 bln
+2.097 bln
7.27%
jan 1, 2014
33.594 bln
+2.657 bln
8.59%
jan 1, 2015
35.827 bln
+2.233 bln
6.65%
jan 1, 2016
37.517 bln
+1.69 bln
4.72%
Ranking of countries by current statistics by years


Comments: