29
/
en
AIzaSyAYiBZKx7MnpbEhh9jyipgxe19OcubqV5w
April 1, 2024
231037
Rwanda
RWA
true
2
1
GDP (current US$)
2016,2015,2014,2013,2012,2011,2010,2009,2008,2007,2006,2005,2004,2003,2002,2001,2000,1999,1998,1997,1996,1995,1994,1993,1992,1991,1990,1989,1988,1987,1986,1985,1984,1983,1982,1981,1980,1979,1978,1977,1976,1975,1974,1973,1972,1971,1970,1969,1968,1967,1966,1965,1964,1963,1962,1961
This statistics in other country:
AfghanistanAlbaniaAlgeriaAndorraAngolaAntigua and BarbudaArab WorldArgentinaArmeniaArubaAustraliaAustriaAzerbaijanBahamas, TheBahrainBangladeshBarbadosBelarusBelgiumBelizeBeninBermudaBhutanBoliviaBosnia and HerzegovinaBotswanaBrazilBrunei DarussalamBulgariaBurkina FasoBurundiCabo VerdeCambodiaCameroonCanadaCaribbean small statesCayman IslandsCentral African RepublicCentral Europe and the BalticsChadChannel IslandsChileChinaColombiaComorosCongo, Dem. Rep.Congo, Rep.Costa RicaCote d'IvoireCroatiaCubaCyprusCzech RepublicDenmarkDjiboutiDominicaDominican RepublicEarly-demographic dividendEast Asia & PacificEast Asia & Pacific (excluding high income)East Asia & Pacific (IDA & IBRD countries)EcuadorEgypt, Arab Rep.El SalvadorEquatorial GuineaEritreaEstoniaEthiopiaEuro areaEurope & Central AsiaEurope & Central Asia (excluding high income)Europe & Central Asia (IDA & IBRD countries)European UnionFaroe IslandsFijiFinlandFragile and conflict affected situationsFranceFrench PolynesiaGabonGambia, TheGeorgiaGermanyGhanaGreeceGreenlandGrenadaGuatemalaGuineaGuinea-BissauGuyanaHaitiHeavily indebted poor countries (HIPC)High incomeHondurasHong Kong SAR, ChinaHungaryIBRD onlyIcelandIDA & IBRD totalIDA blendIDA onlyIDA totalIndiaIndonesiaIran, Islamic Rep.IraqIrelandIsle of ManIsraelItalyJamaicaJapanJordanKazakhstanKenyaKiribatiKorea, Rep.KosovoKuwaitKyrgyz RepublicLao PDRLate-demographic dividendLatin America & Caribbean Latin America & Caribbean (excluding high income)Latin America & the Caribbean (IDA & IBRD countries)LatviaLeast developed countries: UN classificationLebanonLesothoLiberiaLibyaLiechtensteinLithuaniaLow & middle incomeLow incomeLower middle incomeLuxembourgMacao SAR, ChinaMacedonia, FYRMadagascarMalawiMalaysiaMaldivesMaliMaltaMarshall IslandsMauritaniaMauritiusMexicoMicronesia, Fed. Sts.Middle East & North AfricaMiddle East & North Africa (excluding high income)Middle East & North Africa (IDA & IBRD countries)Middle incomeMoldovaMonacoMongoliaMontenegroMoroccoMozambiqueMyanmarNamibiaNauruNepalNetherlandsNew CaledoniaNew ZealandNicaraguaNigerNigeriaNorth AmericaNorwayOECD membersOmanOther small statesPacific island small statesPakistanPalauPanamaPapua New GuineaParaguayPeruPhilippinesPolandPortugalPost-demographic dividendPre-demographic dividendPuerto RicoQatarRomaniaRussian FederationRwandaSamoaSan MarinoSao Tome and PrincipeSaudi ArabiaSenegalSerbiaSeychellesSierra LeoneSingaporeSlovak RepublicSloveniaSmall statesSolomon IslandsSomaliaSouth AfricaSouth AsiaSouth Asia (IDA & IBRD)South SudanSpainSri LankaSt. Kitts and NevisSt. LuciaSt. Vincent and the GrenadinesSub-Saharan Africa Sub-Saharan Africa (excluding high income)Sub-Saharan Africa (IDA & IBRD countries)SudanSurinameSwazilandSwedenSwitzerlandSyrian Arab RepublicTajikistanTanzaniaThailandTimor-LesteTogoTongaTrinidad and TobagoTunisiaTurkeyTurkmenistanTuvaluUgandaUkraineUnited Arab EmiratesUnited KingdomUnited StatesUpper middle incomeUruguayUzbekistanVanuatuVenezuela, RBVietnamVirgin Islands (U.S.)West Bank and GazaWorldYemen, Rep.ZambiaZimbabwe Timeline:
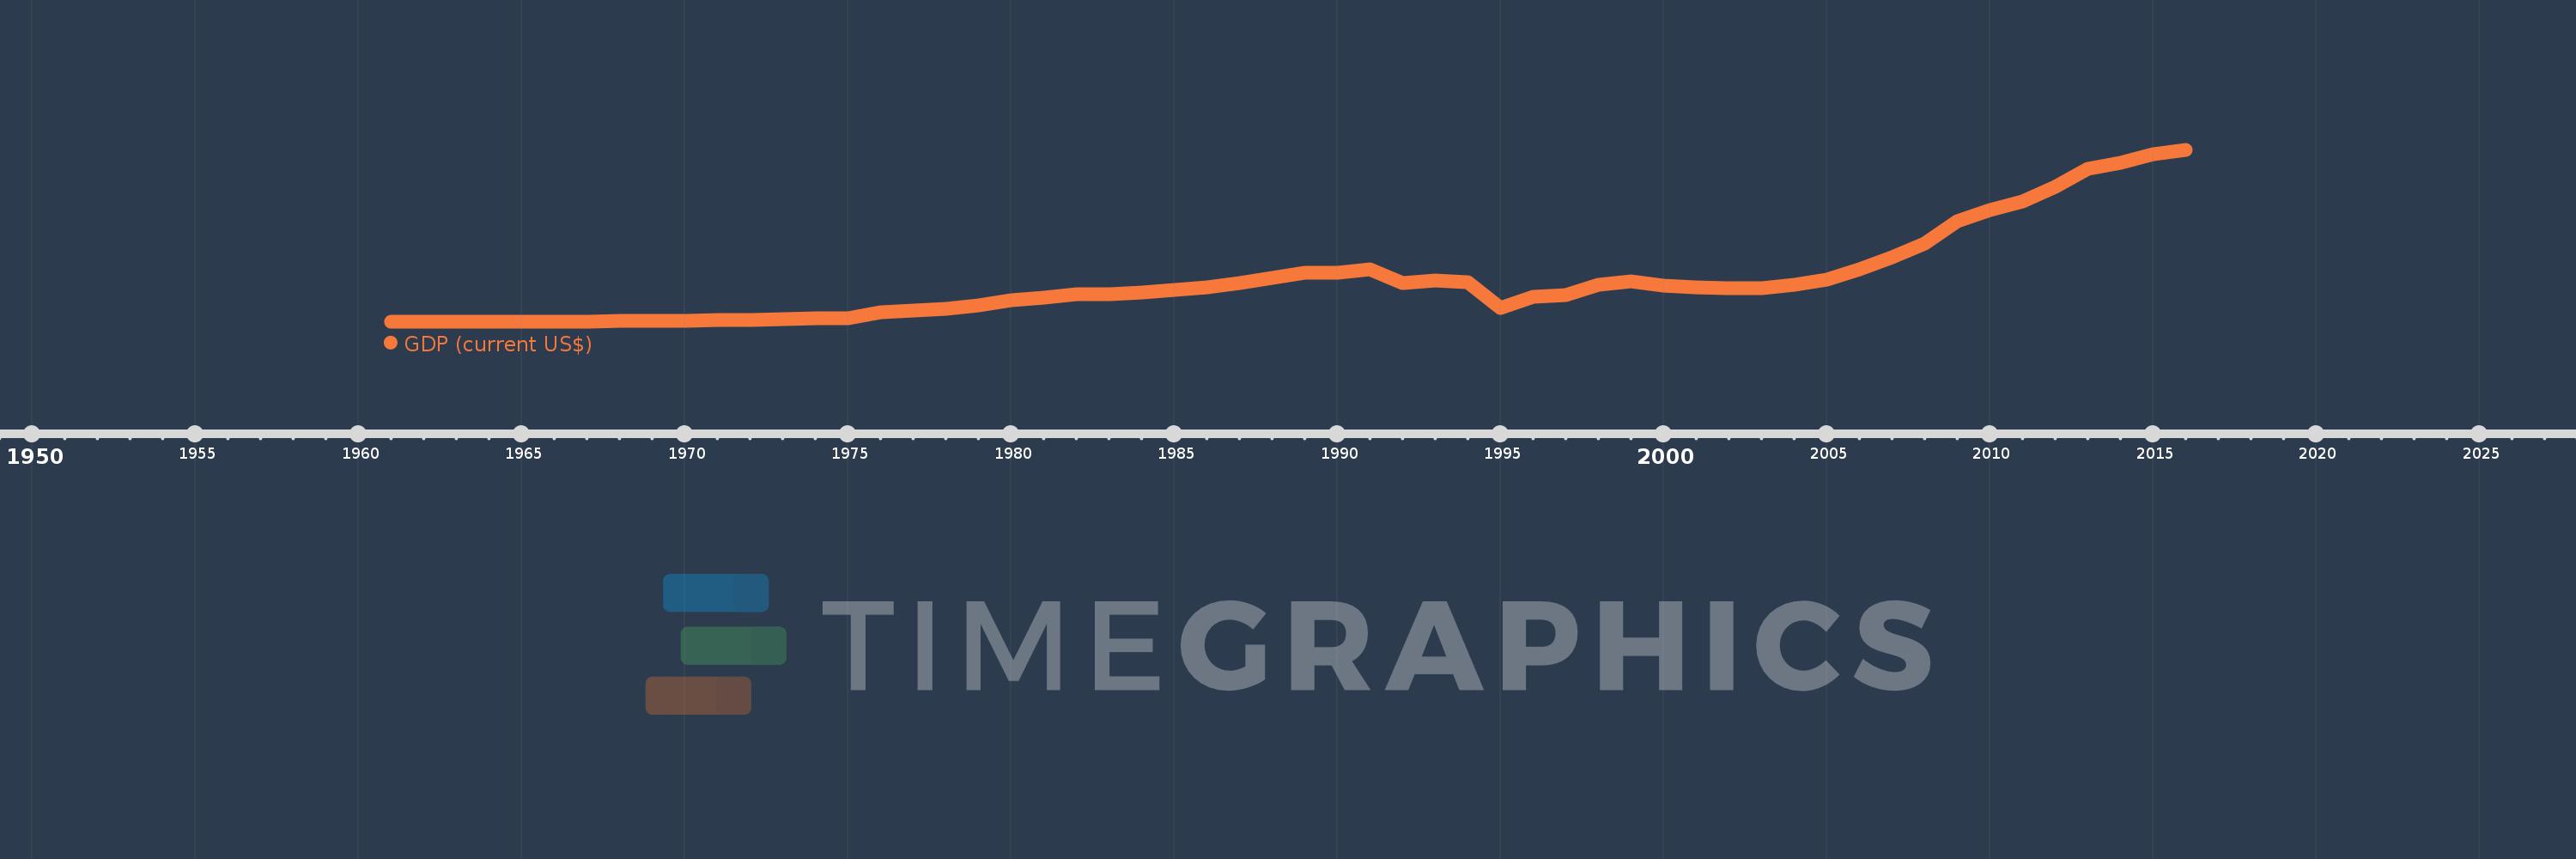
This timeline shows a graph from 1961 to 2016 of Rwanda. No data until 1960. Number of actual observations by date: 56.
Source name:
World Development Indicators
Source organization:
World Bank national accounts data, and OECD National Accounts data files.
Categories, topics:
Economy & Growth
Last updated:
apr 23, 2017
Indicators value changes by year
Minimum:
119.0 mln
jan 1, 1961
Maximum:
8.096 bln
jan 1, 2016
At the date of observation
Value
Absolute change
Change from previous value
jan 1, 1961
119.0 mln
+119.0 mln
0.0%
jan 1, 1962
122.0 mln
+3.0 mln
2.52%
jan 1, 1963
125.0 mln
+3.0 mln
2.46%
jan 1, 1964
128.0 mln
+3.0 mln
2.4%
jan 1, 1965
130.0 mln
+2.0 mln
1.56%
jan 1, 1966
148.8 mln
+18.8 mln
14.46%
jan 1, 1967
124.526 mln
-24.274 mln
-16.31%
jan 1, 1968
159.56 mln
+35.034 mln
28.13%
jan 1, 1969
172.2 mln
+12.64 mln
7.92%
jan 1, 1970
188.7 mln
+16.5 mln
9.58%
jan 1, 1971
219.9 mln
+31.2 mln
16.53%
jan 1, 1972
222.953 mln
+3.053 mln
1.39%
jan 1, 1973
246.458 mln
+23.505 mln
10.54%
jan 1, 1974
290.746 mln
+44.288 mln
17.97%
jan 1, 1975
308.458 mln
+17.712 mln
6.09%
jan 1, 1976
571.863 mln
+263.405 mln
85.39%
jan 1, 1977
637.754 mln
+65.891 mln
11.52%
jan 1, 1978
746.651 mln
+108.896 mln
17.07%
jan 1, 1979
905.709 mln
+159.059 mln
21.3%
jan 1, 1980
1.109 bln
+203.637 mln
22.48%
jan 1, 1981
1.255 bln
+145.419 mln
13.11%
jan 1, 1982
1.407 bln
+152.297 mln
12.14%
jan 1, 1983
1.407 bln
+180.033K
0.01%
jan 1, 1984
1.48 bln
+72.445 mln
5.15%
jan 1, 1985
1.587 bln
+107.725 mln
7.28%
jan 1, 1986
1.716 bln
+128.213 mln
8.08%
jan 1, 1987
1.945 bln
+229.085 mln
13.35%
jan 1, 1988
2.157 bln
+212.723 mln
10.94%
jan 1, 1989
2.395 bln
+238.06 mln
11.03%
jan 1, 1990
2.405 bln
+9.528 mln
0.4%
jan 1, 1991
2.55 bln
+145.164 mln
6.04%
jan 1, 1992
1.912 bln
-638.585 mln
-25.04%
jan 1, 1993
2.029 bln
+117.426 mln
6.14%
jan 1, 1994
1.972 bln
-57.501 mln
-2.83%
jan 1, 1995
753.636 mln
-1.218 bln
-61.77%
jan 1, 1996
1.294 bln
+539.899 mln
71.64%
jan 1, 1997
1.382 bln
+88.8 mln
6.86%
jan 1, 1998
1.852 bln
+469.223 mln
33.94%
jan 1, 1999
1.989 bln
+137.785 mln
7.44%
jan 1, 2000
1.818 bln
-171.688 mln
-8.63%
jan 1, 2001
1.735 bln
-82.717 mln
-4.55%
jan 1, 2002
1.675 bln
-60.253 mln
-3.47%
jan 1, 2003
1.677 bln
+2.762 mln
0.16%
jan 1, 2004
1.846 bln
+168.532 mln
10.05%
jan 1, 2005
2.089 bln
+243.21 mln
13.18%
jan 1, 2006
2.581 bln
+492.277 mln
23.56%
jan 1, 2007
3.11 bln
+528.862 mln
20.49%
jan 1, 2008
3.775 bln
+665.12 mln
21.38%
jan 1, 2009
4.797 bln
+1.021 bln
27.05%
jan 1, 2010
5.309 bln
+512.417 mln
10.68%
jan 1, 2011
5.699 bln
+389.559 mln
7.34%
jan 1, 2012
6.407 bln
+708.178 mln
12.43%
jan 1, 2013
7.22 bln
+812.93 mln
12.69%
jan 1, 2014
7.522 bln
+302.349 mln
4.19%
jan 1, 2015
7.912 bln
+390.155 mln
5.19%
jan 1, 2016
8.096 bln
+183.818 mln
2.32%
Ranking of countries by current statistics by years


Comments: