29
/
en
AIzaSyAYiBZKx7MnpbEhh9jyipgxe19OcubqV5w
April 1, 2024
191396
Malta
MLT
true
2
1
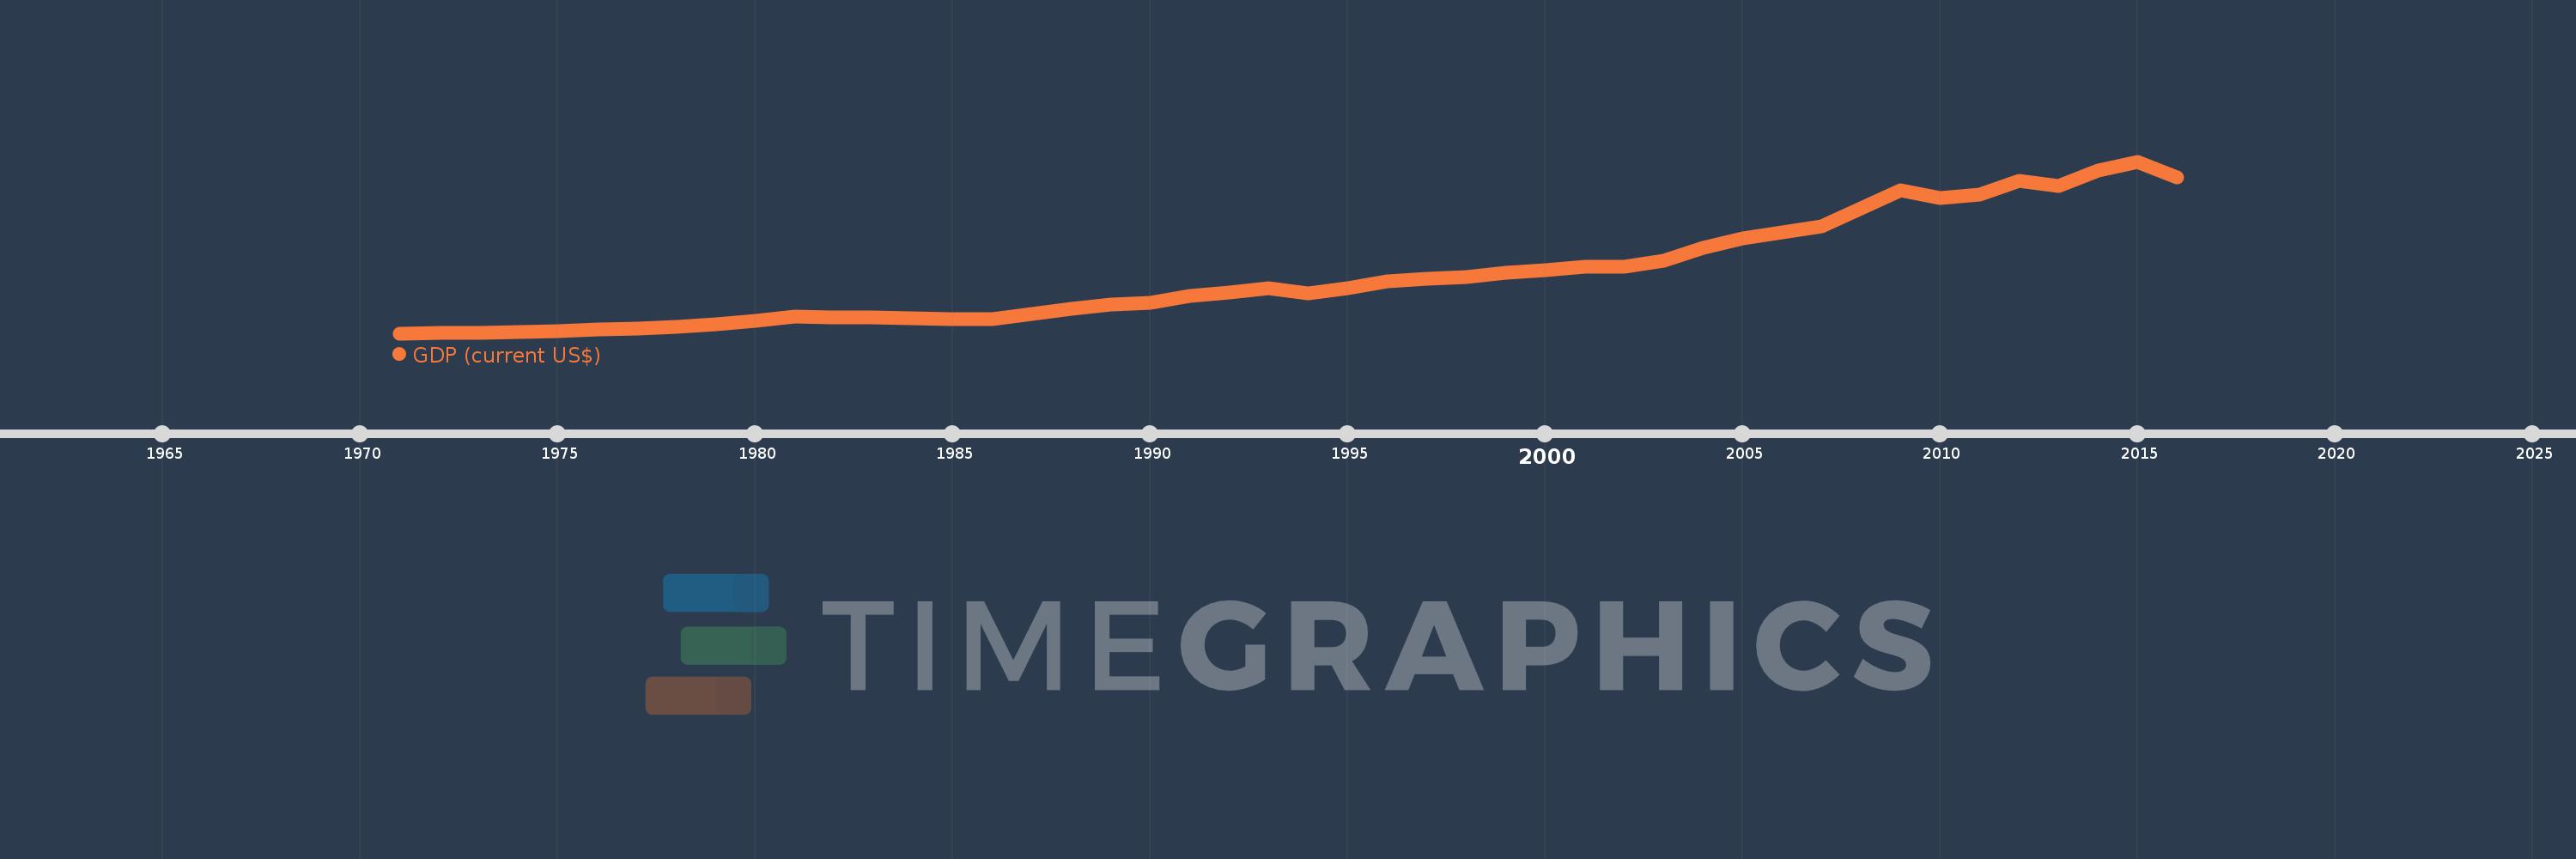
GDP (current US$)
2016,2015,2014,2013,2012,2011,2010,2009,2008,2007,2006,2005,2004,2003,2002,2001,2000,1999,1998,1997,1996,1995,1994,1993,1992,1991,1990,1989,1988,1987,1986,1985,1984,1983,1982,1981,1980,1979,1978,1977,1976,1975,1974,1973,1972,1971
This statistics in other country:
AfghanistanAlbaniaAlgeriaAndorraAngolaAntigua and BarbudaArab WorldArgentinaArmeniaArubaAustraliaAustriaAzerbaijanBahamas, TheBahrainBangladeshBarbadosBelarusBelgiumBelizeBeninBermudaBhutanBoliviaBosnia and HerzegovinaBotswanaBrazilBrunei DarussalamBulgariaBurkina FasoBurundiCabo VerdeCambodiaCameroonCanadaCaribbean small statesCayman IslandsCentral African RepublicCentral Europe and the BalticsChadChannel IslandsChileChinaColombiaComorosCongo, Dem. Rep.Congo, Rep.Costa RicaCote d'IvoireCroatiaCubaCyprusCzech RepublicDenmarkDjiboutiDominicaDominican RepublicEarly-demographic dividendEast Asia & PacificEast Asia & Pacific (excluding high income)East Asia & Pacific (IDA & IBRD countries)EcuadorEgypt, Arab Rep.El SalvadorEquatorial GuineaEritreaEstoniaEthiopiaEuro areaEurope & Central AsiaEurope & Central Asia (excluding high income)Europe & Central Asia (IDA & IBRD countries)European UnionFaroe IslandsFijiFinlandFragile and conflict affected situationsFranceFrench PolynesiaGabonGambia, TheGeorgiaGermanyGhanaGreeceGreenlandGrenadaGuatemalaGuineaGuinea-BissauGuyanaHaitiHeavily indebted poor countries (HIPC)High incomeHondurasHong Kong SAR, ChinaHungaryIBRD onlyIcelandIDA & IBRD totalIDA blendIDA onlyIDA totalIndiaIndonesiaIran, Islamic Rep.IraqIrelandIsle of ManIsraelItalyJamaicaJapanJordanKazakhstanKenyaKiribatiKorea, Rep.KosovoKuwaitKyrgyz RepublicLao PDRLate-demographic dividendLatin America & Caribbean Latin America & Caribbean (excluding high income)Latin America & the Caribbean (IDA & IBRD countries)LatviaLeast developed countries: UN classificationLebanonLesothoLiberiaLibyaLiechtensteinLithuaniaLow & middle incomeLow incomeLower middle incomeLuxembourgMacao SAR, ChinaMacedonia, FYRMadagascarMalawiMalaysiaMaldivesMaliMaltaMarshall IslandsMauritaniaMauritiusMexicoMicronesia, Fed. Sts.Middle East & North AfricaMiddle East & North Africa (excluding high income)Middle East & North Africa (IDA & IBRD countries)Middle incomeMoldovaMonacoMongoliaMontenegroMoroccoMozambiqueMyanmarNamibiaNauruNepalNetherlandsNew CaledoniaNew ZealandNicaraguaNigerNigeriaNorth AmericaNorwayOECD membersOmanOther small statesPacific island small statesPakistanPalauPanamaPapua New GuineaParaguayPeruPhilippinesPolandPortugalPost-demographic dividendPre-demographic dividendPuerto RicoQatarRomaniaRussian FederationRwandaSamoaSan MarinoSao Tome and PrincipeSaudi ArabiaSenegalSerbiaSeychellesSierra LeoneSingaporeSlovak RepublicSloveniaSmall statesSolomon IslandsSomaliaSouth AfricaSouth AsiaSouth Asia (IDA & IBRD)South SudanSpainSri LankaSt. Kitts and NevisSt. LuciaSt. Vincent and the GrenadinesSub-Saharan Africa Sub-Saharan Africa (excluding high income)Sub-Saharan Africa (IDA & IBRD countries)SudanSurinameSwazilandSwedenSwitzerlandSyrian Arab RepublicTajikistanTanzaniaThailandTimor-LesteTogoTongaTrinidad and TobagoTunisiaTurkeyTurkmenistanTuvaluUgandaUkraineUnited Arab EmiratesUnited KingdomUnited StatesUpper middle incomeUruguayUzbekistanVanuatuVenezuela, RBVietnamVirgin Islands (U.S.)West Bank and GazaWorldYemen, Rep.ZambiaZimbabwe Timeline:
This timeline shows a graph from 1971 to 2016 of Malta. No data until 1970. Number of actual observations by date: 46.
Source name:
World Development Indicators
Source organization:
World Bank national accounts data, and OECD National Accounts data files.
Categories, topics:
Economy & Growth
Last updated:
apr 23, 2017
Indicators value changes by year
Minimum:
250.722 mln
jan 1, 1971
Maximum:
10.738 bln
jan 1, 2015
At the date of observation
Value
Absolute change
Change from previous value
jan 1, 1971
250.722 mln
+250.722 mln
0.0%
jan 1, 1972
264.58 mln
+13.858 mln
5.53%
jan 1, 1973
295.118 mln
+30.538 mln
11.54%
jan 1, 1974
345.602 mln
+50.484 mln
17.11%
jan 1, 1975
376.094 mln
+30.492 mln
8.82%
jan 1, 1976
474.62 mln
+98.526 mln
26.2%
jan 1, 1977
527.937 mln
+53.317 mln
11.23%
jan 1, 1978
625.573 mln
+97.636 mln
18.49%
jan 1, 1979
793.675 mln
+168.102 mln
26.87%
jan 1, 1980
1.001 bln
+207.626 mln
26.16%
jan 1, 1981
1.25 bln
+248.941 mln
24.86%
jan 1, 1982
1.243 bln
-6.773 mln
-0.54%
jan 1, 1983
1.235 bln
-8.951 mln
-0.72%
jan 1, 1984
1.166 bln
-68.747 mln
-5.57%
jan 1, 1985
1.102 bln
-63.943 mln
-5.49%
jan 1, 1986
1.118 bln
+16.007 mln
1.45%
jan 1, 1987
1.435 bln
+317.244 mln
28.38%
jan 1, 1988
1.751 bln
+316.169 mln
22.03%
jan 1, 1989
2.019 bln
+268.226 mln
15.32%
jan 1, 1990
2.119 bln
+99.101 mln
4.91%
jan 1, 1991
2.547 bln
+428.589 mln
20.23%
jan 1, 1992
2.75 bln
+202.878 mln
7.96%
jan 1, 1993
3.022 bln
+271.869 mln
9.89%
jan 1, 1994
2.709 bln
-312.732 mln
-10.35%
jan 1, 1995
2.999 bln
+289.392 mln
10.68%
jan 1, 1996
3.44 bln
+441.362 mln
14.72%
jan 1, 1997
3.57 bln
+130.34 mln
3.79%
jan 1, 1998
3.705 bln
+135.1 mln
3.78%
jan 1, 1999
3.924 bln
+218.266 mln
5.89%
jan 1, 2000
4.127 bln
+203.676 mln
5.19%
jan 1, 2001
4.306 bln
+178.879 mln
4.33%
jan 1, 2002
4.332 bln
+25.678 mln
0.6%
jan 1, 2003
4.69 bln
+357.962 mln
8.26%
jan 1, 2004
5.457 bln
+766.751 mln
16.35%
jan 1, 2005
6.063 bln
+606.197 mln
11.11%
jan 1, 2006
6.395 bln
+332.071 mln
5.48%
jan 1, 2007
6.757 bln
+362.268 mln
5.66%
jan 1, 2008
7.881 bln
+1.123 bln
16.63%
jan 1, 2009
8.977 bln
+1.097 bln
13.92%
jan 1, 2010
8.528 bln
-448.947 mln
-5.0%
jan 1, 2011
8.741 bln
+212.857 mln
2.5%
jan 1, 2012
9.556 bln
+815.376 mln
9.33%
jan 1, 2013
9.262 bln
-294.198 mln
-3.08%
jan 1, 2014
10.185 bln
+922.706 mln
9.96%
jan 1, 2015
10.738 bln
+552.617 mln
5.43%
jan 1, 2016
9.746 bln
-991.082 mln
-9.23%
Ranking of countries by current statistics by years


Comments: