29
/
en
AIzaSyAYiBZKx7MnpbEhh9jyipgxe19OcubqV5w
April 1, 2024
227409
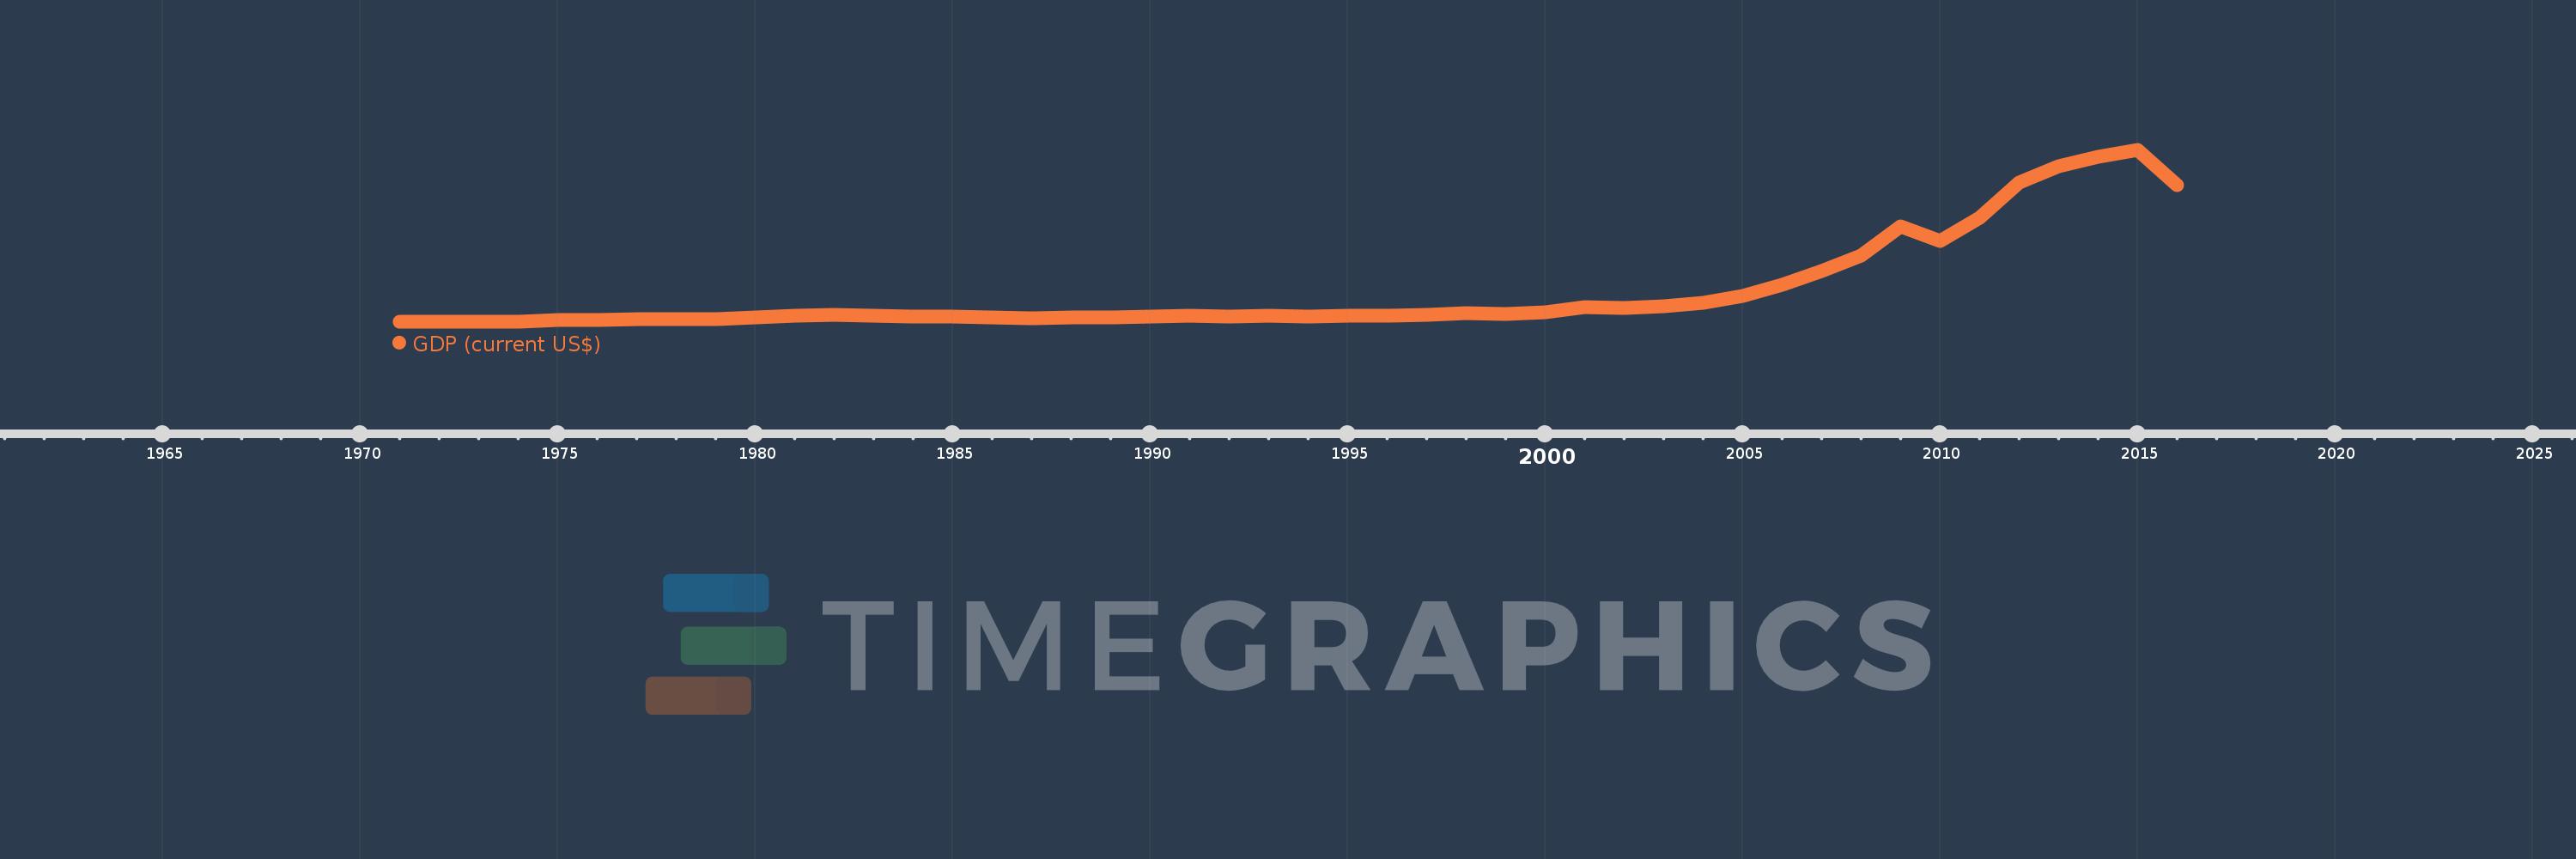
Qatar
QAT
true
2
1
GDP (current US$)
2016,2015,2014,2013,2012,2011,2010,2009,2008,2007,2006,2005,2004,2003,2002,2001,2000,1999,1998,1997,1996,1995,1994,1993,1992,1991,1990,1989,1988,1987,1986,1985,1984,1983,1982,1981,1980,1979,1978,1977,1976,1975,1974,1973,1972,1971
This statistics in other country:
AfghanistanAlbaniaAlgeriaAndorraAngolaAntigua and BarbudaArab WorldArgentinaArmeniaArubaAustraliaAustriaAzerbaijanBahamas, TheBahrainBangladeshBarbadosBelarusBelgiumBelizeBeninBermudaBhutanBoliviaBosnia and HerzegovinaBotswanaBrazilBrunei DarussalamBulgariaBurkina FasoBurundiCabo VerdeCambodiaCameroonCanadaCaribbean small statesCayman IslandsCentral African RepublicCentral Europe and the BalticsChadChannel IslandsChileChinaColombiaComorosCongo, Dem. Rep.Congo, Rep.Costa RicaCote d'IvoireCroatiaCubaCyprusCzech RepublicDenmarkDjiboutiDominicaDominican RepublicEarly-demographic dividendEast Asia & PacificEast Asia & Pacific (excluding high income)East Asia & Pacific (IDA & IBRD countries)EcuadorEgypt, Arab Rep.El SalvadorEquatorial GuineaEritreaEstoniaEthiopiaEuro areaEurope & Central AsiaEurope & Central Asia (excluding high income)Europe & Central Asia (IDA & IBRD countries)European UnionFaroe IslandsFijiFinlandFragile and conflict affected situationsFranceFrench PolynesiaGabonGambia, TheGeorgiaGermanyGhanaGreeceGreenlandGrenadaGuatemalaGuineaGuinea-BissauGuyanaHaitiHeavily indebted poor countries (HIPC)High incomeHondurasHong Kong SAR, ChinaHungaryIBRD onlyIcelandIDA & IBRD totalIDA blendIDA onlyIDA totalIndiaIndonesiaIran, Islamic Rep.IraqIrelandIsle of ManIsraelItalyJamaicaJapanJordanKazakhstanKenyaKiribatiKorea, Rep.KosovoKuwaitKyrgyz RepublicLao PDRLate-demographic dividendLatin America & Caribbean Latin America & Caribbean (excluding high income)Latin America & the Caribbean (IDA & IBRD countries)LatviaLeast developed countries: UN classificationLebanonLesothoLiberiaLibyaLiechtensteinLithuaniaLow & middle incomeLow incomeLower middle incomeLuxembourgMacao SAR, ChinaMacedonia, FYRMadagascarMalawiMalaysiaMaldivesMaliMaltaMarshall IslandsMauritaniaMauritiusMexicoMicronesia, Fed. Sts.Middle East & North AfricaMiddle East & North Africa (excluding high income)Middle East & North Africa (IDA & IBRD countries)Middle incomeMoldovaMonacoMongoliaMontenegroMoroccoMozambiqueMyanmarNamibiaNauruNepalNetherlandsNew CaledoniaNew ZealandNicaraguaNigerNigeriaNorth AmericaNorwayOECD membersOmanOther small statesPacific island small statesPakistanPalauPanamaPapua New GuineaParaguayPeruPhilippinesPolandPortugalPost-demographic dividendPre-demographic dividendPuerto RicoQatarRomaniaRussian FederationRwandaSamoaSan MarinoSao Tome and PrincipeSaudi ArabiaSenegalSerbiaSeychellesSierra LeoneSingaporeSlovak RepublicSloveniaSmall statesSolomon IslandsSomaliaSouth AfricaSouth AsiaSouth Asia (IDA & IBRD)South SudanSpainSri LankaSt. Kitts and NevisSt. LuciaSt. Vincent and the GrenadinesSub-Saharan Africa Sub-Saharan Africa (excluding high income)Sub-Saharan Africa (IDA & IBRD countries)SudanSurinameSwazilandSwedenSwitzerlandSyrian Arab RepublicTajikistanTanzaniaThailandTimor-LesteTogoTongaTrinidad and TobagoTunisiaTurkeyTurkmenistanTuvaluUgandaUkraineUnited Arab EmiratesUnited KingdomUnited StatesUpper middle incomeUruguayUzbekistanVanuatuVenezuela, RBVietnamVirgin Islands (U.S.)West Bank and GazaWorldYemen, Rep.ZambiaZimbabwe Timeline:
This timeline shows a graph from 1971 to 2016 of Qatar. No data until 1970. Number of actual observations by date: 46.
Source name:
World Development Indicators
Source organization:
World Bank national accounts data, and OECD National Accounts data files.
Categories, topics:
Economy & Growth
Last updated:
apr 23, 2017
Indicators value changes by year
Minimum:
301.791 mln
jan 1, 1971
Maximum:
206.225 bln
jan 1, 2015
At the date of observation
Value
Absolute change
Change from previous value
jan 1, 1971
301.791 mln
+301.791 mln
0.0%
jan 1, 1972
387.7 mln
+85.909 mln
28.47%
jan 1, 1973
510.26 mln
+122.56 mln
31.61%
jan 1, 1974
793.884 mln
+283.624 mln
55.58%
jan 1, 1975
2.401 bln
+1.608 bln
202.49%
jan 1, 1976
2.513 bln
+111.381 mln
4.64%
jan 1, 1977
3.284 bln
+771.517 mln
30.7%
jan 1, 1978
3.618 bln
+333.279 mln
10.15%
jan 1, 1979
4.052 bln
+434.42 mln
12.01%
jan 1, 1980
5.633 bln
+1.581 bln
39.02%
jan 1, 1981
7.829 bln
+2.196 bln
38.99%
jan 1, 1982
8.661 bln
+832.169 mln
10.63%
jan 1, 1983
7.597 bln
-1.065 bln
-12.29%
jan 1, 1984
6.468 bln
-1.129 bln
-14.86%
jan 1, 1985
6.704 bln
+236.814 mln
3.66%
jan 1, 1986
6.153 bln
-551.099 mln
-8.22%
jan 1, 1987
5.053 bln
-1.1 bln
-17.88%
jan 1, 1988
5.446 bln
+393.407 mln
7.79%
jan 1, 1989
6.038 bln
+591.758 mln
10.87%
jan 1, 1990
6.488 bln
+449.725 mln
7.45%
jan 1, 1991
7.36 bln
+872.527 mln
13.45%
jan 1, 1992
6.884 bln
-476.923 mln
-6.48%
jan 1, 1993
7.646 bln
+762.638 mln
11.08%
jan 1, 1994
7.157 bln
-489.56 mln
-6.4%
jan 1, 1995
7.374 bln
+217.857 mln
3.04%
jan 1, 1996
8.138 bln
+763.461 mln
10.35%
jan 1, 1997
9.059 bln
+921.428 mln
11.32%
jan 1, 1998
11.298 bln
+2.238 bln
24.71%
jan 1, 1999
10.255 bln
-1.042 bln
-9.23%
jan 1, 2000
12.393 bln
+2.138 bln
20.84%
jan 1, 2001
17.76 bln
+5.367 bln
43.3%
jan 1, 2002
17.538 bln
-221.429 mln
-1.25%
jan 1, 2003
19.364 bln
+1.825 bln
10.41%
jan 1, 2004
23.534 bln
+4.17 bln
21.54%
jan 1, 2005
31.734 bln
+8.2 bln
34.84%
jan 1, 2006
44.53 bln
+12.796 bln
40.32%
jan 1, 2007
60.882 bln
+16.352 bln
36.72%
jan 1, 2008
79.712 bln
+18.83 bln
30.93%
jan 1, 2009
115.27 bln
+35.558 bln
44.61%
jan 1, 2010
97.798 bln
-17.472 bln
-15.16%
jan 1, 2011
125.122 bln
+27.324 bln
27.94%
jan 1, 2012
167.775 bln
+42.653 bln
34.09%
jan 1, 2013
186.834 bln
+19.058 bln
11.36%
jan 1, 2014
198.728 bln
+11.894 bln
6.37%
jan 1, 2015
206.225 bln
+7.497 bln
3.77%
jan 1, 2016
164.641 bln
-41.583 bln
-20.16%
Ranking of countries by current statistics by years


Comments: