29
/
en
AIzaSyAYiBZKx7MnpbEhh9jyipgxe19OcubqV5w
April 1, 2024
98585
Cambodia
KHM
true
2
1
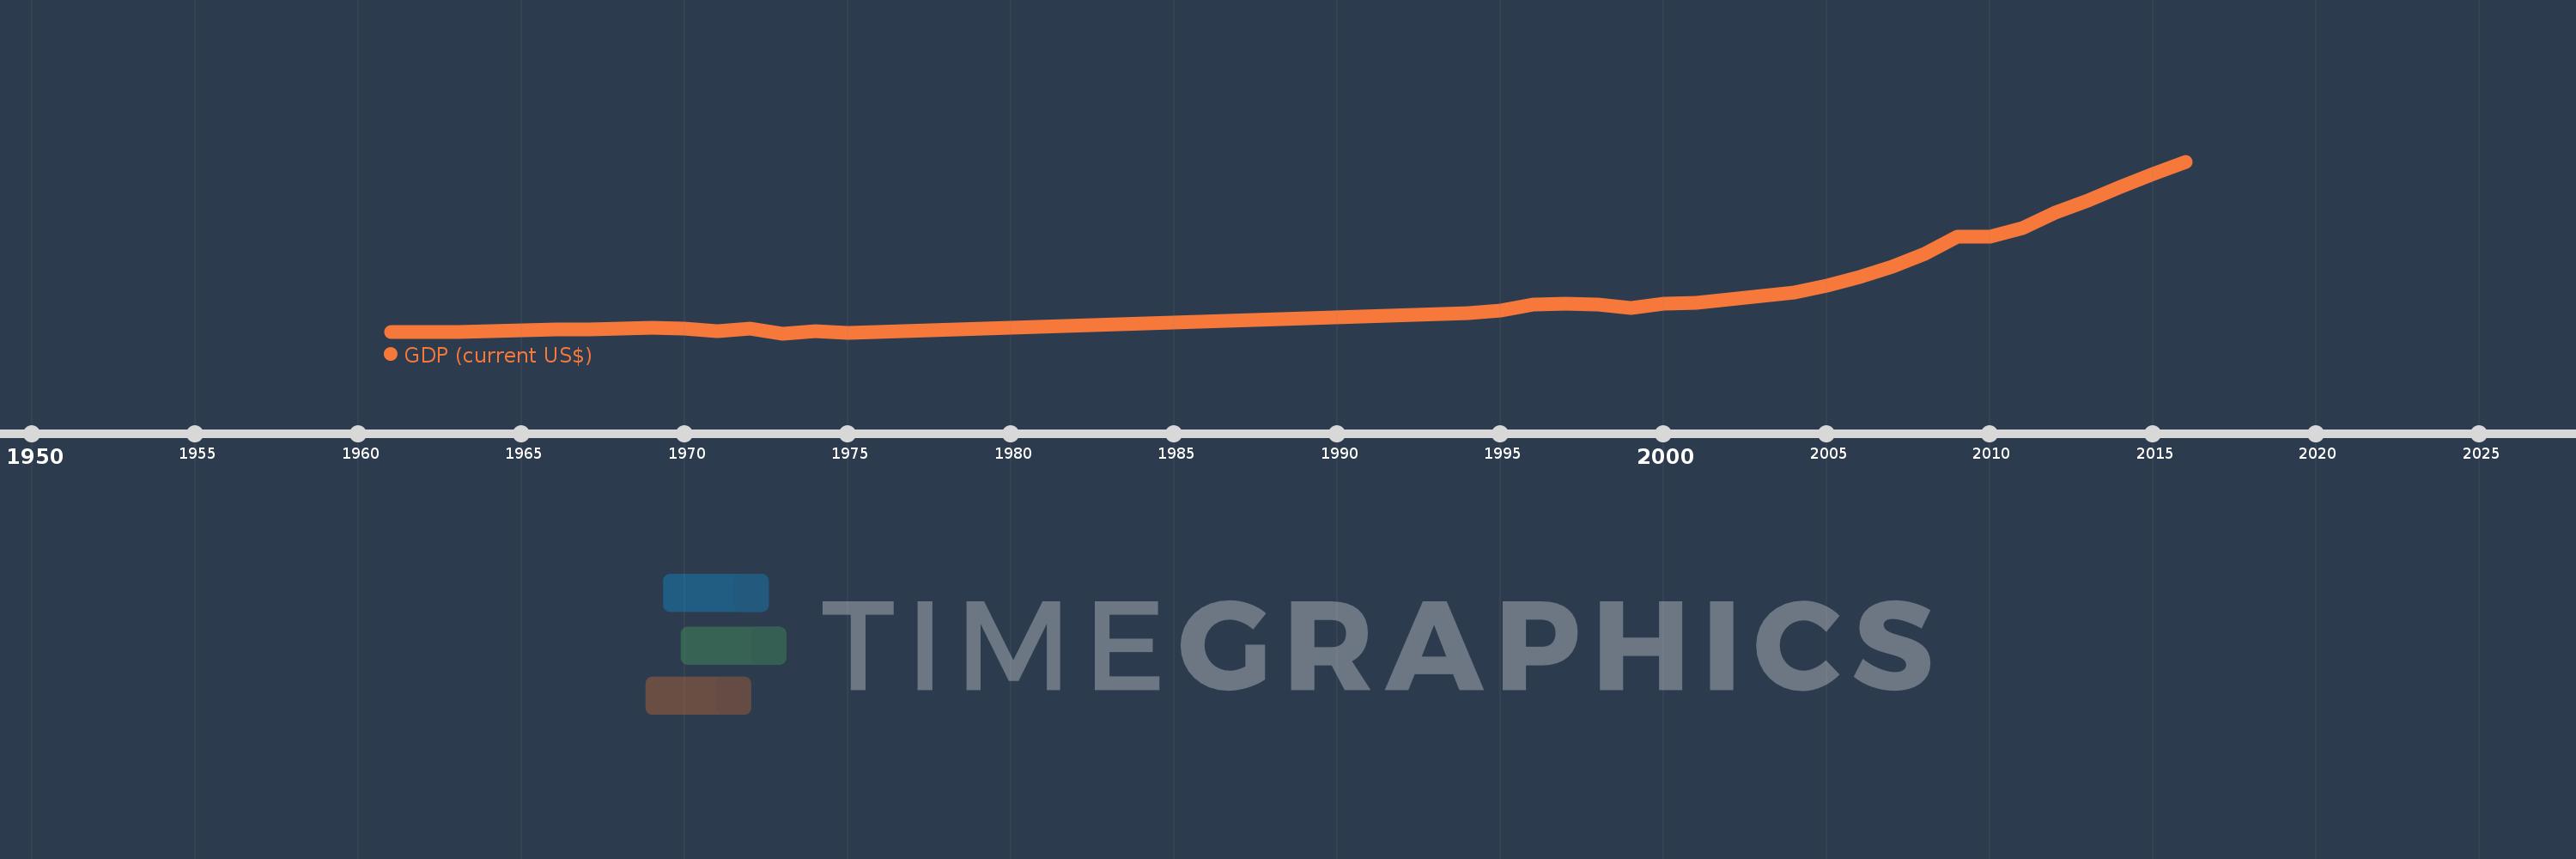
GDP (current US$)
2016,2015,2014,2013,2012,2011,2010,2009,2008,2007,2006,2005,2004,2003,2002,2001,2000,1999,1998,1997,1996,1995,1994,1975,1974,1973,1972,1971,1970,1969,1968,1967,1966,1965,1964,1963,1962,1961
This statistics in other country:
AfghanistanAlbaniaAlgeriaAndorraAngolaAntigua and BarbudaArab WorldArgentinaArmeniaArubaAustraliaAustriaAzerbaijanBahamas, TheBahrainBangladeshBarbadosBelarusBelgiumBelizeBeninBermudaBhutanBoliviaBosnia and HerzegovinaBotswanaBrazilBrunei DarussalamBulgariaBurkina FasoBurundiCabo VerdeCambodiaCameroonCanadaCaribbean small statesCayman IslandsCentral African RepublicCentral Europe and the BalticsChadChannel IslandsChileChinaColombiaComorosCongo, Dem. Rep.Congo, Rep.Costa RicaCote d'IvoireCroatiaCubaCyprusCzech RepublicDenmarkDjiboutiDominicaDominican RepublicEarly-demographic dividendEast Asia & PacificEast Asia & Pacific (excluding high income)East Asia & Pacific (IDA & IBRD countries)EcuadorEgypt, Arab Rep.El SalvadorEquatorial GuineaEritreaEstoniaEthiopiaEuro areaEurope & Central AsiaEurope & Central Asia (excluding high income)Europe & Central Asia (IDA & IBRD countries)European UnionFaroe IslandsFijiFinlandFragile and conflict affected situationsFranceFrench PolynesiaGabonGambia, TheGeorgiaGermanyGhanaGreeceGreenlandGrenadaGuatemalaGuineaGuinea-BissauGuyanaHaitiHeavily indebted poor countries (HIPC)High incomeHondurasHong Kong SAR, ChinaHungaryIBRD onlyIcelandIDA & IBRD totalIDA blendIDA onlyIDA totalIndiaIndonesiaIran, Islamic Rep.IraqIrelandIsle of ManIsraelItalyJamaicaJapanJordanKazakhstanKenyaKiribatiKorea, Rep.KosovoKuwaitKyrgyz RepublicLao PDRLate-demographic dividendLatin America & Caribbean Latin America & Caribbean (excluding high income)Latin America & the Caribbean (IDA & IBRD countries)LatviaLeast developed countries: UN classificationLebanonLesothoLiberiaLibyaLiechtensteinLithuaniaLow & middle incomeLow incomeLower middle incomeLuxembourgMacao SAR, ChinaMacedonia, FYRMadagascarMalawiMalaysiaMaldivesMaliMaltaMarshall IslandsMauritaniaMauritiusMexicoMicronesia, Fed. Sts.Middle East & North AfricaMiddle East & North Africa (excluding high income)Middle East & North Africa (IDA & IBRD countries)Middle incomeMoldovaMonacoMongoliaMontenegroMoroccoMozambiqueMyanmarNamibiaNauruNepalNetherlandsNew CaledoniaNew ZealandNicaraguaNigerNigeriaNorth AmericaNorwayOECD membersOmanOther small statesPacific island small statesPakistanPalauPanamaPapua New GuineaParaguayPeruPhilippinesPolandPortugalPost-demographic dividendPre-demographic dividendPuerto RicoQatarRomaniaRussian FederationRwandaSamoaSan MarinoSao Tome and PrincipeSaudi ArabiaSenegalSerbiaSeychellesSierra LeoneSingaporeSlovak RepublicSloveniaSmall statesSolomon IslandsSomaliaSouth AfricaSouth AsiaSouth Asia (IDA & IBRD)South SudanSpainSri LankaSt. Kitts and NevisSt. LuciaSt. Vincent and the GrenadinesSub-Saharan Africa Sub-Saharan Africa (excluding high income)Sub-Saharan Africa (IDA & IBRD countries)SudanSurinameSwazilandSwedenSwitzerlandSyrian Arab RepublicTajikistanTanzaniaThailandTimor-LesteTogoTongaTrinidad and TobagoTunisiaTurkeyTurkmenistanTuvaluUgandaUkraineUnited Arab EmiratesUnited KingdomUnited StatesUpper middle incomeUruguayUzbekistanVanuatuVenezuela, RBVietnamVirgin Islands (U.S.)West Bank and GazaWorldYemen, Rep.ZambiaZimbabwe Timeline:
This timeline shows a graph from 1961 to 2016 of Cambodia. No data until 1960. Number of actual observations by date: 38.
Source name:
World Development Indicators
Source organization:
World Bank national accounts data, and OECD National Accounts data files.
Categories, topics:
Economy & Growth
Last updated:
apr 23, 2017
Indicators value changes by year
Minimum:
505.549 mln
jan 1, 1973
Maximum:
18.05 bln
jan 1, 2016
At the date of observation
Value
Absolute change
Change from previous value
jan 1, 1961
637.143 mln
+637.143 mln
0.0%
jan 1, 1962
642.857 mln
+5.714 mln
0.9%
jan 1, 1963
660.0 mln
+17.143 mln
2.67%
jan 1, 1964
728.571 mln
+68.571 mln
10.39%
jan 1, 1965
782.857 mln
+54.286 mln
7.45%
jan 1, 1966
868.571 mln
+85.714 mln
10.95%
jan 1, 1967
914.286 mln
+45.714 mln
5.26%
jan 1, 1968
962.857 mln
+48.571 mln
5.31%
jan 1, 1969
1.066 bln
+102.857 mln
10.68%
jan 1, 1970
978.873 mln
-86.841 mln
-8.15%
jan 1, 1971
718.401 mln
-260.472 mln
-26.61%
jan 1, 1972
969.911 mln
+251.51 mln
35.01%
jan 1, 1973
505.549 mln
-464.362 mln
-47.88%
jan 1, 1974
702.899 mln
+197.35 mln
39.04%
jan 1, 1975
588.444 mln
-114.455 mln
-16.28%
jan 1, 1994
2.534 bln
+1.945 bln
330.58%
jan 1, 1995
2.791 bln
+257.708 mln
10.17%
jan 1, 1996
3.441 bln
+649.77 mln
23.28%
jan 1, 1997
3.507 bln
+65.49 mln
1.9%
jan 1, 1998
3.443 bln
-63.282 mln
-1.8%
jan 1, 1999
3.12 bln
-322.988 mln
-9.38%
jan 1, 2000
3.517 bln
+396.817 mln
12.72%
jan 1, 2001
3.654 bln
+136.789 mln
3.89%
jan 1, 2002
3.98 bln
+325.782 mln
8.92%
jan 1, 2003
4.284 bln
+304.215 mln
7.64%
jan 1, 2004
4.658 bln
+374.219 mln
8.74%
jan 1, 2005
5.338 bln
+679.586 mln
14.59%
jan 1, 2006
6.293 bln
+955.213 mln
17.9%
jan 1, 2007
7.275 bln
+981.55 mln
15.6%
jan 1, 2008
8.639 bln
+1.365 bln
18.76%
jan 1, 2009
10.352 bln
+1.713 bln
19.82%
jan 1, 2010
10.402 bln
+49.938 mln
0.48%
jan 1, 2011
11.242 bln
+840.423 mln
8.08%
jan 1, 2012
12.83 bln
+1.587 bln
14.12%
jan 1, 2013
14.038 bln
+1.209 bln
9.42%
jan 1, 2014
15.45 bln
+1.411 bln
10.05%
jan 1, 2015
16.778 bln
+1.328 bln
8.6%
jan 1, 2016
18.05 bln
+1.272 bln
7.58%
Ranking of countries by current statistics by years


Comments: