29
/
en
AIzaSyAYiBZKx7MnpbEhh9jyipgxe19OcubqV5w
April 1, 2024
210362
Nicaragua
NIC
true
2
1
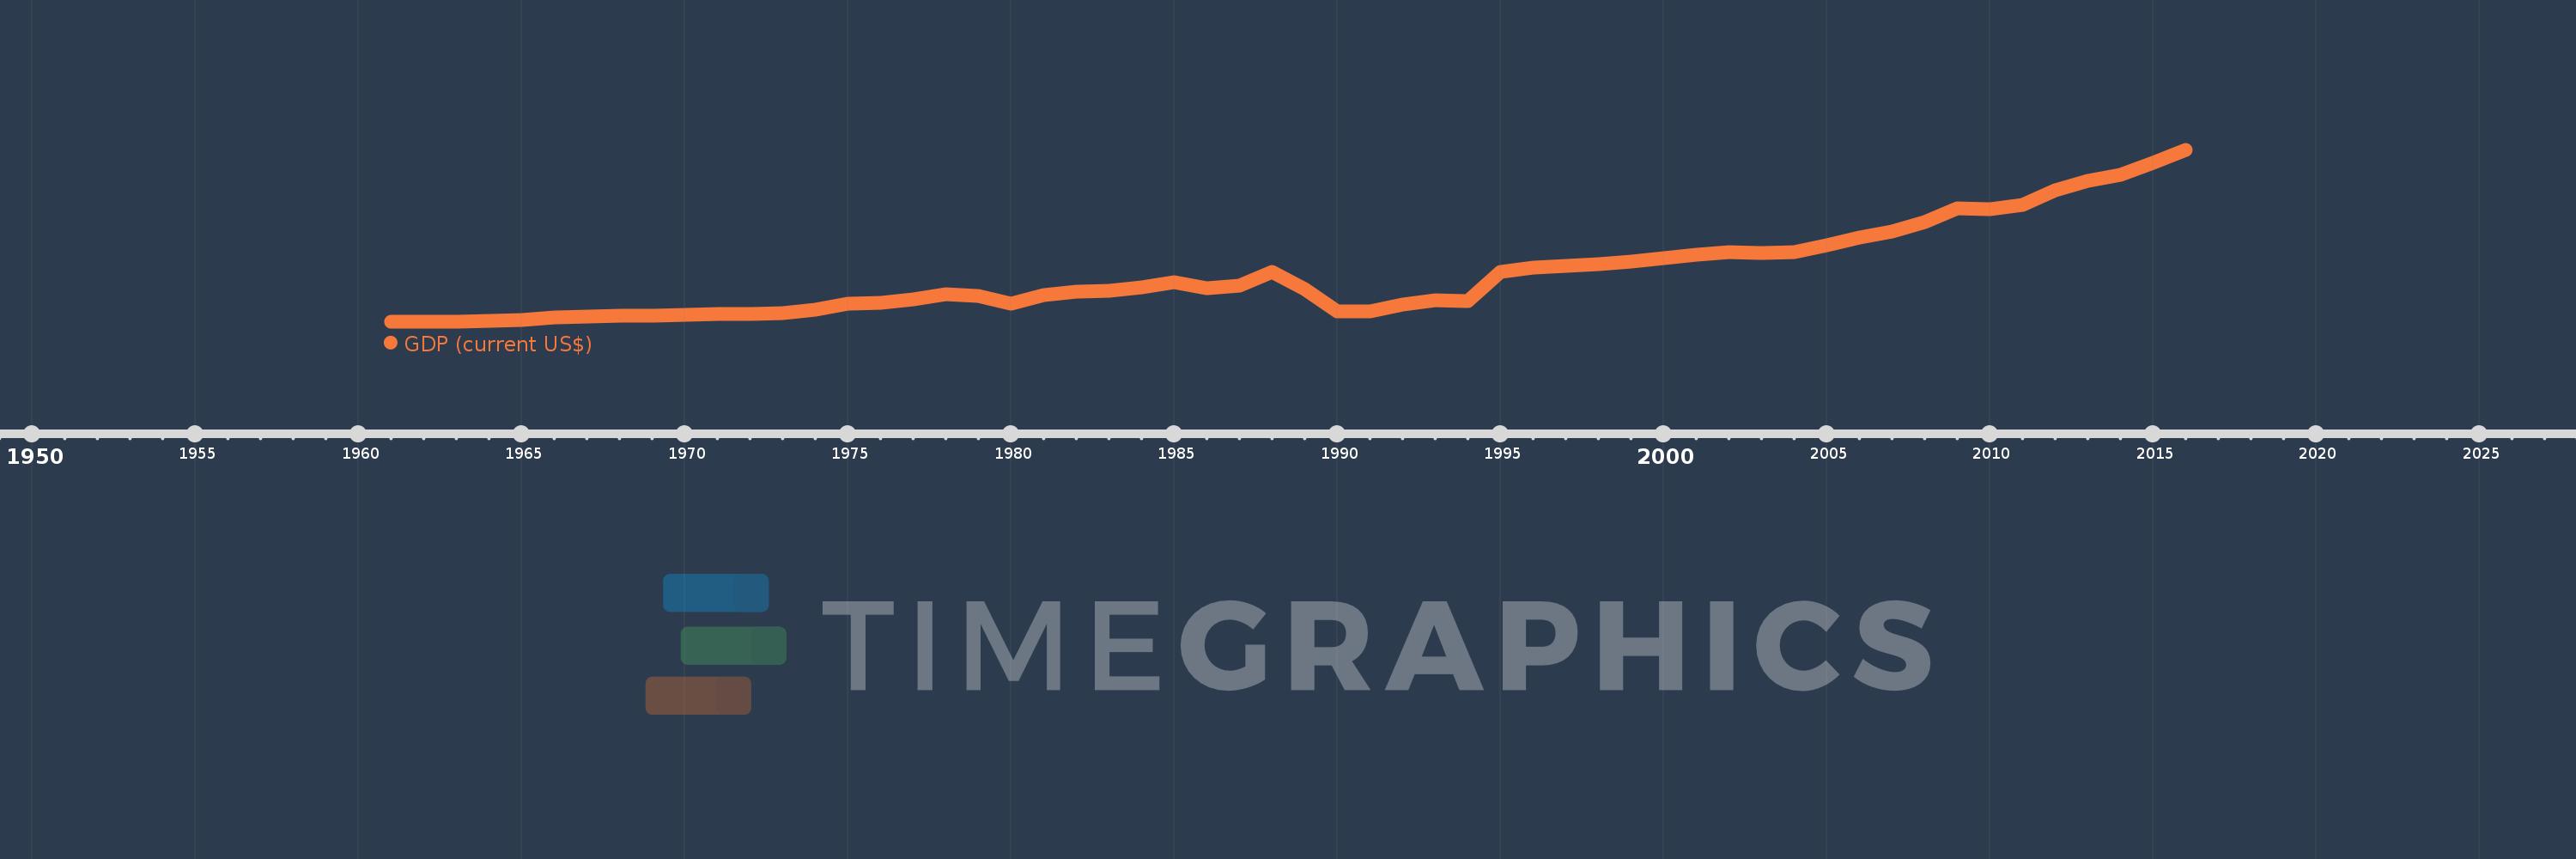
GDP (current US$)
2016,2015,2014,2013,2012,2011,2010,2009,2008,2007,2006,2005,2004,2003,2002,2001,2000,1999,1998,1997,1996,1995,1994,1993,1992,1991,1990,1989,1988,1987,1986,1985,1984,1983,1982,1981,1980,1979,1978,1977,1976,1975,1974,1973,1972,1971,1970,1969,1968,1967,1966,1965,1964,1963,1962,1961
This statistics in other country:
AfghanistanAlbaniaAlgeriaAndorraAngolaAntigua and BarbudaArab WorldArgentinaArmeniaArubaAustraliaAustriaAzerbaijanBahamas, TheBahrainBangladeshBarbadosBelarusBelgiumBelizeBeninBermudaBhutanBoliviaBosnia and HerzegovinaBotswanaBrazilBrunei DarussalamBulgariaBurkina FasoBurundiCabo VerdeCambodiaCameroonCanadaCaribbean small statesCayman IslandsCentral African RepublicCentral Europe and the BalticsChadChannel IslandsChileChinaColombiaComorosCongo, Dem. Rep.Congo, Rep.Costa RicaCote d'IvoireCroatiaCubaCyprusCzech RepublicDenmarkDjiboutiDominicaDominican RepublicEarly-demographic dividendEast Asia & PacificEast Asia & Pacific (excluding high income)East Asia & Pacific (IDA & IBRD countries)EcuadorEgypt, Arab Rep.El SalvadorEquatorial GuineaEritreaEstoniaEthiopiaEuro areaEurope & Central AsiaEurope & Central Asia (excluding high income)Europe & Central Asia (IDA & IBRD countries)European UnionFaroe IslandsFijiFinlandFragile and conflict affected situationsFranceFrench PolynesiaGabonGambia, TheGeorgiaGermanyGhanaGreeceGreenlandGrenadaGuatemalaGuineaGuinea-BissauGuyanaHaitiHeavily indebted poor countries (HIPC)High incomeHondurasHong Kong SAR, ChinaHungaryIBRD onlyIcelandIDA & IBRD totalIDA blendIDA onlyIDA totalIndiaIndonesiaIran, Islamic Rep.IraqIrelandIsle of ManIsraelItalyJamaicaJapanJordanKazakhstanKenyaKiribatiKorea, Rep.KosovoKuwaitKyrgyz RepublicLao PDRLate-demographic dividendLatin America & Caribbean Latin America & Caribbean (excluding high income)Latin America & the Caribbean (IDA & IBRD countries)LatviaLeast developed countries: UN classificationLebanonLesothoLiberiaLibyaLiechtensteinLithuaniaLow & middle incomeLow incomeLower middle incomeLuxembourgMacao SAR, ChinaMacedonia, FYRMadagascarMalawiMalaysiaMaldivesMaliMaltaMarshall IslandsMauritaniaMauritiusMexicoMicronesia, Fed. Sts.Middle East & North AfricaMiddle East & North Africa (excluding high income)Middle East & North Africa (IDA & IBRD countries)Middle incomeMoldovaMonacoMongoliaMontenegroMoroccoMozambiqueMyanmarNamibiaNauruNepalNetherlandsNew CaledoniaNew ZealandNicaraguaNigerNigeriaNorth AmericaNorwayOECD membersOmanOther small statesPacific island small statesPakistanPalauPanamaPapua New GuineaParaguayPeruPhilippinesPolandPortugalPost-demographic dividendPre-demographic dividendPuerto RicoQatarRomaniaRussian FederationRwandaSamoaSan MarinoSao Tome and PrincipeSaudi ArabiaSenegalSerbiaSeychellesSierra LeoneSingaporeSlovak RepublicSloveniaSmall statesSolomon IslandsSomaliaSouth AfricaSouth AsiaSouth Asia (IDA & IBRD)South SudanSpainSri LankaSt. Kitts and NevisSt. LuciaSt. Vincent and the GrenadinesSub-Saharan Africa Sub-Saharan Africa (excluding high income)Sub-Saharan Africa (IDA & IBRD countries)SudanSurinameSwazilandSwedenSwitzerlandSyrian Arab RepublicTajikistanTanzaniaThailandTimor-LesteTogoTongaTrinidad and TobagoTunisiaTurkeyTurkmenistanTuvaluUgandaUkraineUnited Arab EmiratesUnited KingdomUnited StatesUpper middle incomeUruguayUzbekistanVanuatuVenezuela, RBVietnamVirgin Islands (U.S.)West Bank and GazaWorldYemen, Rep.ZambiaZimbabwe Timeline:
This timeline shows a graph from 1961 to 2016 of Nicaragua. No data until 1960. Number of actual observations by date: 56.
Source name:
World Development Indicators
Source organization:
World Bank national accounts data, and OECD National Accounts data files.
Categories, topics:
Economy & Growth
Last updated:
apr 23, 2017
Indicators value changes by year
Minimum:
223.855 mln
jan 1, 1961
Maximum:
12.693 bln
jan 1, 2016
At the date of observation
Value
Absolute change
Change from previous value
jan 1, 1961
223.855 mln
+223.855 mln
0.0%
jan 1, 1962
240.525 mln
+16.67 mln
7.45%
jan 1, 1963
265.292 mln
+24.767 mln
10.3%
jan 1, 1964
292.916 mln
+27.625 mln
10.41%
jan 1, 1965
341.974 mln
+49.058 mln
16.75%
jan 1, 1966
566.543 mln
+224.569 mln
65.67%
jan 1, 1967
606.671 mln
+40.129 mln
7.08%
jan 1, 1968
657.171 mln
+50.5 mln
8.32%
jan 1, 1969
695.9 mln
+38.729 mln
5.89%
jan 1, 1970
747.971 mln
+52.071 mln
7.48%
jan 1, 1971
776.586 mln
+28.614 mln
3.83%
jan 1, 1972
826.571 mln
+49.986 mln
6.44%
jan 1, 1973
880.843 mln
+54.271 mln
6.57%
jan 1, 1974
1.094 bln
+212.729 mln
24.15%
jan 1, 1975
1.521 bln
+427.329 mln
39.08%
jan 1, 1976
1.59 bln
+69.528 mln
4.57%
jan 1, 1977
1.848 bln
+257.443 mln
16.19%
jan 1, 1978
2.24 bln
+391.986 mln
21.21%
jan 1, 1979
2.142 bln
-97.728 mln
-4.36%
jan 1, 1980
1.528 bln
-614.276 mln
-28.68%
jan 1, 1981
2.189 bln
+661.495 mln
43.3%
jan 1, 1982
2.448 bln
+258.943 mln
11.83%
jan 1, 1983
2.465 bln
+16.875 mln
0.69%
jan 1, 1984
2.743 bln
+278.177 mln
11.28%
jan 1, 1985
3.106 bln
+362.175 mln
13.2%
jan 1, 1986
2.684 bln
-421.701 mln
-13.58%
jan 1, 1987
2.886 bln
+201.894 mln
7.52%
jan 1, 1988
3.851 bln
+965.503 mln
33.46%
jan 1, 1989
2.631 bln
-1.22 bln
-31.69%
jan 1, 1990
1.013 bln
-1.618 bln
-61.49%
jan 1, 1991
1.009 bln
-3.729 mln
-0.37%
jan 1, 1992
1.489 bln
+479.349 mln
47.49%
jan 1, 1993
1.793 bln
+303.996 mln
20.42%
jan 1, 1994
1.756 bln
-36.346 mln
-2.03%
jan 1, 1995
3.863 bln
+2.107 bln
119.94%
jan 1, 1996
4.14 bln
+277.285 mln
7.18%
jan 1, 1997
4.308 bln
+167.882 mln
4.05%
jan 1, 1998
4.39 bln
+81.614 mln
1.89%
jan 1, 1999
4.635 bln
+245.302 mln
5.59%
jan 1, 2000
4.856 bln
+220.451 mln
4.76%
jan 1, 2001
5.107 bln
+251.611 mln
5.18%
jan 1, 2002
5.323 bln
+215.818 mln
4.23%
jan 1, 2003
5.224 bln
-98.934 mln
-1.86%
jan 1, 2004
5.322 bln
+98.242 mln
1.88%
jan 1, 2005
5.796 bln
+473.113 mln
8.89%
jan 1, 2006
6.321 bln
+525.767 mln
9.07%
jan 1, 2007
6.786 bln
+464.959 mln
7.36%
jan 1, 2008
7.458 bln
+671.809 mln
9.9%
jan 1, 2009
8.491 bln
+1.033 bln
13.85%
jan 1, 2010
8.381 bln
-110.657 mln
-1.3%
jan 1, 2011
8.741 bln
+360.581 mln
4.3%
jan 1, 2012
9.756 bln
+1.014 bln
11.6%
jan 1, 2013
10.439 bln
+683.222 mln
7.0%
jan 1, 2014
10.875 bln
+435.893 mln
4.18%
jan 1, 2015
11.79 bln
+915.487 mln
8.42%
jan 1, 2016
12.693 bln
+902.34 mln
7.65%
Ranking of countries by current statistics by years


Comments: