29
/
en
AIzaSyAYiBZKx7MnpbEhh9jyipgxe19OcubqV5w
April 1, 2024
42378
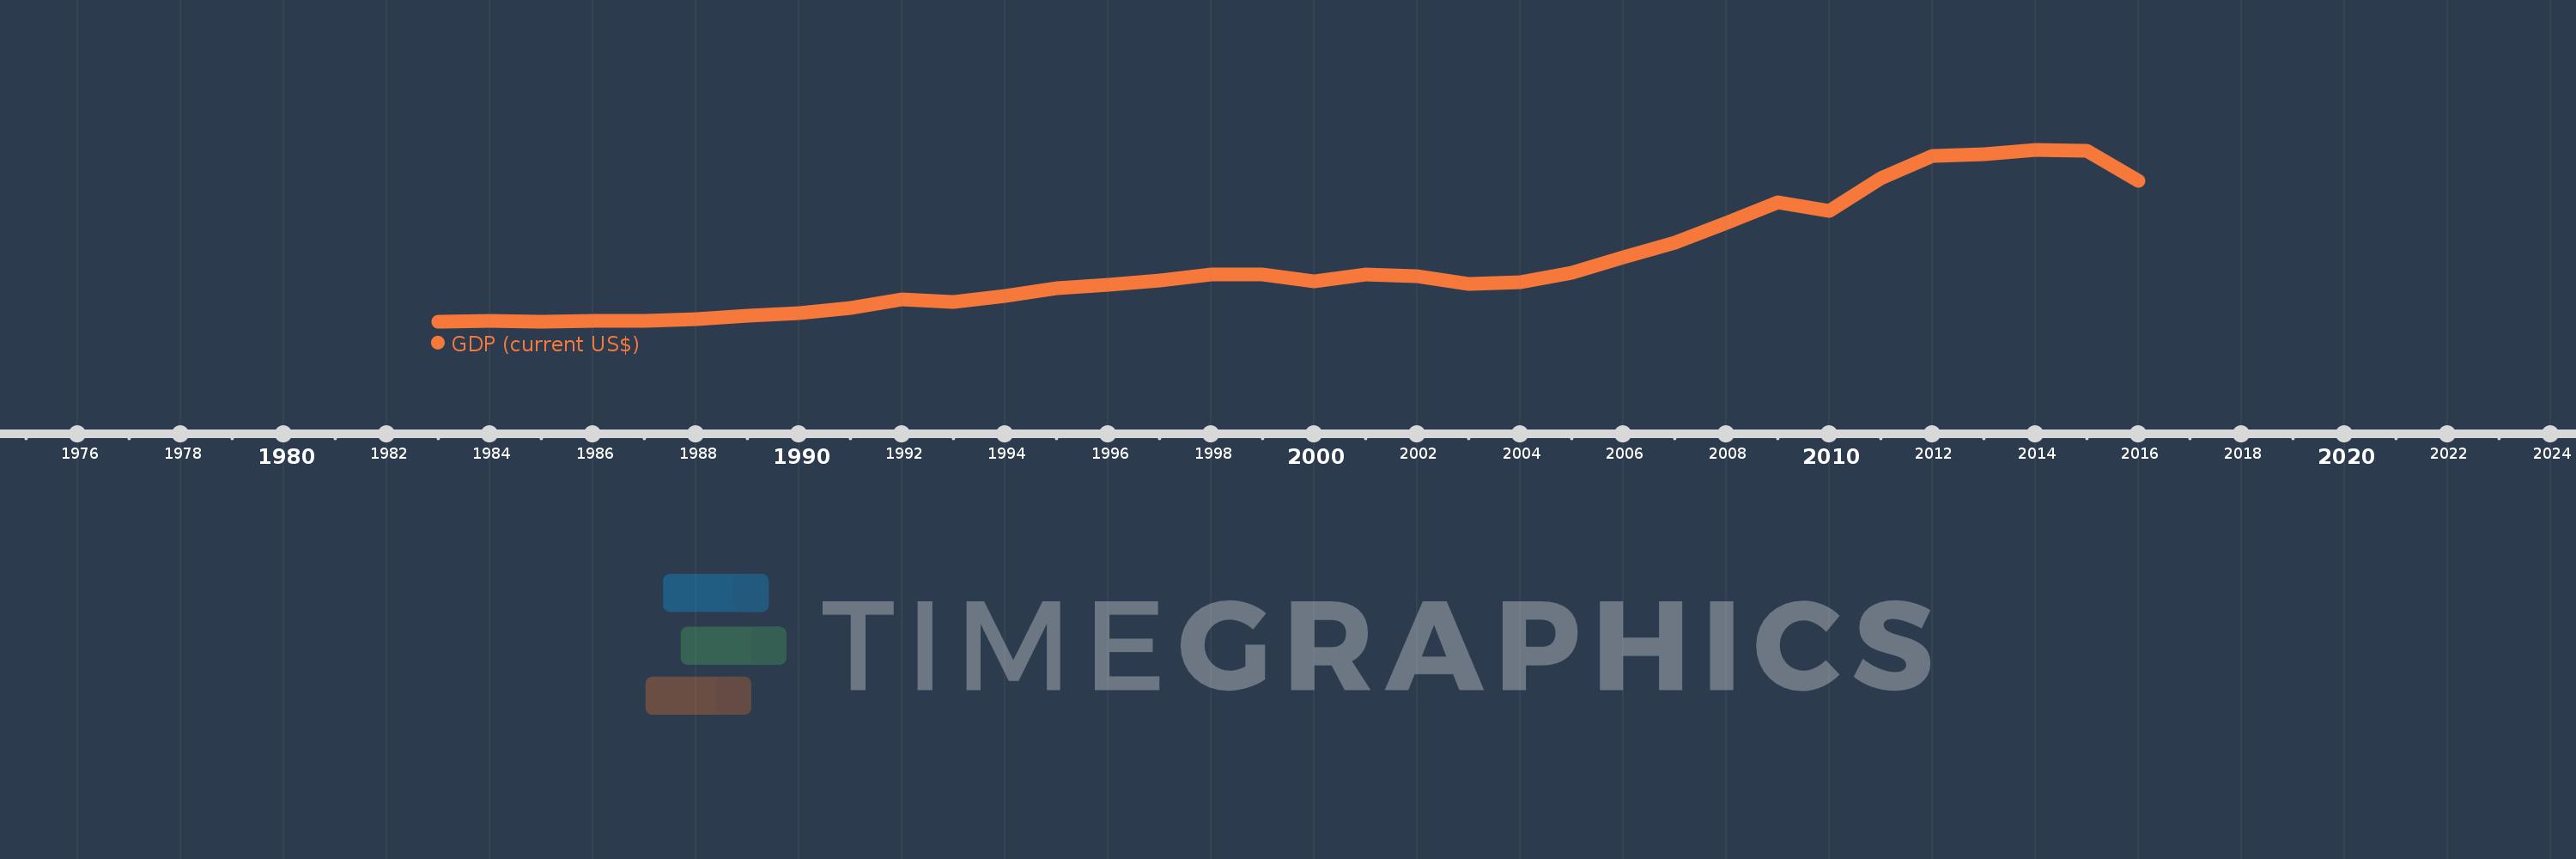
Latin America & Caribbean (excluding high income)
LAC
false
2
1
GDP (current US$)
2016,2015,2014,2013,2012,2011,2010,2009,2008,2007,2006,2005,2004,2003,2002,2001,2000,1999,1998,1997,1996,1995,1994,1993,1992,1991,1990,1989,1988,1987,1986,1985,1984,1983
This statistics in other country:
AfghanistanAlbaniaAlgeriaAndorraAngolaAntigua and BarbudaArab WorldArgentinaArmeniaArubaAustraliaAustriaAzerbaijanBahamas, TheBahrainBangladeshBarbadosBelarusBelgiumBelizeBeninBermudaBhutanBoliviaBosnia and HerzegovinaBotswanaBrazilBrunei DarussalamBulgariaBurkina FasoBurundiCabo VerdeCambodiaCameroonCanadaCaribbean small statesCayman IslandsCentral African RepublicCentral Europe and the BalticsChadChannel IslandsChileChinaColombiaComorosCongo, Dem. Rep.Congo, Rep.Costa RicaCote d'IvoireCroatiaCubaCyprusCzech RepublicDenmarkDjiboutiDominicaDominican RepublicEarly-demographic dividendEast Asia & PacificEast Asia & Pacific (excluding high income)East Asia & Pacific (IDA & IBRD countries)EcuadorEgypt, Arab Rep.El SalvadorEquatorial GuineaEritreaEstoniaEthiopiaEuro areaEurope & Central AsiaEurope & Central Asia (excluding high income)Europe & Central Asia (IDA & IBRD countries)European UnionFaroe IslandsFijiFinlandFragile and conflict affected situationsFranceFrench PolynesiaGabonGambia, TheGeorgiaGermanyGhanaGreeceGreenlandGrenadaGuatemalaGuineaGuinea-BissauGuyanaHaitiHeavily indebted poor countries (HIPC)High incomeHondurasHong Kong SAR, ChinaHungaryIBRD onlyIcelandIDA & IBRD totalIDA blendIDA onlyIDA totalIndiaIndonesiaIran, Islamic Rep.IraqIrelandIsle of ManIsraelItalyJamaicaJapanJordanKazakhstanKenyaKiribatiKorea, Rep.KosovoKuwaitKyrgyz RepublicLao PDRLate-demographic dividendLatin America & Caribbean Latin America & Caribbean (excluding high income)Latin America & the Caribbean (IDA & IBRD countries)LatviaLeast developed countries: UN classificationLebanonLesothoLiberiaLibyaLiechtensteinLithuaniaLow & middle incomeLow incomeLower middle incomeLuxembourgMacao SAR, ChinaMacedonia, FYRMadagascarMalawiMalaysiaMaldivesMaliMaltaMarshall IslandsMauritaniaMauritiusMexicoMicronesia, Fed. Sts.Middle East & North AfricaMiddle East & North Africa (excluding high income)Middle East & North Africa (IDA & IBRD countries)Middle incomeMoldovaMonacoMongoliaMontenegroMoroccoMozambiqueMyanmarNamibiaNauruNepalNetherlandsNew CaledoniaNew ZealandNicaraguaNigerNigeriaNorth AmericaNorwayOECD membersOmanOther small statesPacific island small statesPakistanPalauPanamaPapua New GuineaParaguayPeruPhilippinesPolandPortugalPost-demographic dividendPre-demographic dividendPuerto RicoQatarRomaniaRussian FederationRwandaSamoaSan MarinoSao Tome and PrincipeSaudi ArabiaSenegalSerbiaSeychellesSierra LeoneSingaporeSlovak RepublicSloveniaSmall statesSolomon IslandsSomaliaSouth AfricaSouth AsiaSouth Asia (IDA & IBRD)South SudanSpainSri LankaSt. Kitts and NevisSt. LuciaSt. Vincent and the GrenadinesSub-Saharan Africa Sub-Saharan Africa (excluding high income)Sub-Saharan Africa (IDA & IBRD countries)SudanSurinameSwazilandSwedenSwitzerlandSyrian Arab RepublicTajikistanTanzaniaThailandTimor-LesteTogoTongaTrinidad and TobagoTunisiaTurkeyTurkmenistanTuvaluUgandaUkraineUnited Arab EmiratesUnited KingdomUnited StatesUpper middle incomeUruguayUzbekistanVanuatuVenezuela, RBVietnamVirgin Islands (U.S.)West Bank and GazaWorldYemen, Rep.ZambiaZimbabwe Timeline:
This timeline shows a graph from 1983 to 2016 of Latin America & Caribbean (excluding high income). No data until 1982. Number of actual observations by date: 34.
Source name:
World Development Indicators
Source organization:
World Bank national accounts data, and OECD National Accounts data files.
Categories, topics:
Economy & Growth
Last updated:
apr 23, 2017
Indicators value changes by year
Minimum:
665.229 bln
jan 1, 1985
Maximum:
5.766 trl
jan 1, 2014
At the date of observation
Value
Absolute change
Change from previous value
jan 1, 1983
671.539 bln
+671.539 bln
0.0%
jan 1, 1984
695.014 bln
+23.475 bln
3.5%
jan 1, 1985
665.229 bln
-29.785 bln
-4.29%
jan 1, 1986
691.48 bln
+26.251 bln
3.95%
jan 1, 1987
705.552 bln
+14.072 bln
2.04%
jan 1, 1988
739.505 bln
+33.953 bln
4.81%
jan 1, 1989
846.61 bln
+107.105 bln
14.48%
jan 1, 1990
925.411 bln
+78.801 bln
9.31%
jan 1, 1991
1.081 trl
+155.798 bln
16.84%
jan 1, 1992
1.341 trl
+260.245 bln
24.07%
jan 1, 1993
1.248 trl
-93.872 bln
-7.0%
jan 1, 1994
1.446 trl
+198.567 bln
15.92%
jan 1, 1995
1.664 trl
+217.608 bln
15.05%
jan 1, 1996
1.76 trl
+96.635 bln
5.81%
jan 1, 1997
1.895 trl
+134.695 bln
7.65%
jan 1, 1998
2.074 trl
+179.022 bln
9.45%
jan 1, 1999
2.085 trl
+11.12 bln
0.54%
jan 1, 2000
1.867 trl
-217.779 bln
-10.44%
jan 1, 2001
2.071 trl
+203.318 bln
10.89%
jan 1, 2002
2.014 trl
-57.138 bln
-2.76%
jan 1, 2003
1.791 trl
-222.271 bln
-11.04%
jan 1, 2004
1.839 trl
+48.063 bln
2.68%
jan 1, 2005
2.121 trl
+282.035 bln
15.33%
jan 1, 2006
2.58 trl
+459.026 bln
21.64%
jan 1, 2007
3.031 trl
+450.216 bln
17.45%
jan 1, 2008
3.599 trl
+568.676 bln
18.76%
jan 1, 2009
4.215 trl
+615.235 bln
17.09%
jan 1, 2010
3.954 trl
-260.446 bln
-6.18%
jan 1, 2011
4.926 trl
+972.025 bln
24.58%
jan 1, 2012
5.606 trl
+679.925 bln
13.8%
jan 1, 2013
5.638 trl
+31.83 bln
0.57%
jan 1, 2014
5.766 trl
+128.327 bln
2.28%
jan 1, 2015
5.754 trl
-12.437 bln
-0.22%
jan 1, 2016
4.855 trl
-899.211 bln
-15.63%
Ranking of countries by current statistics by years


Comments: