29
/
en
AIzaSyAYiBZKx7MnpbEhh9jyipgxe19OcubqV5w
April 1, 2024
186507
Malawi
MWI
true
2
1
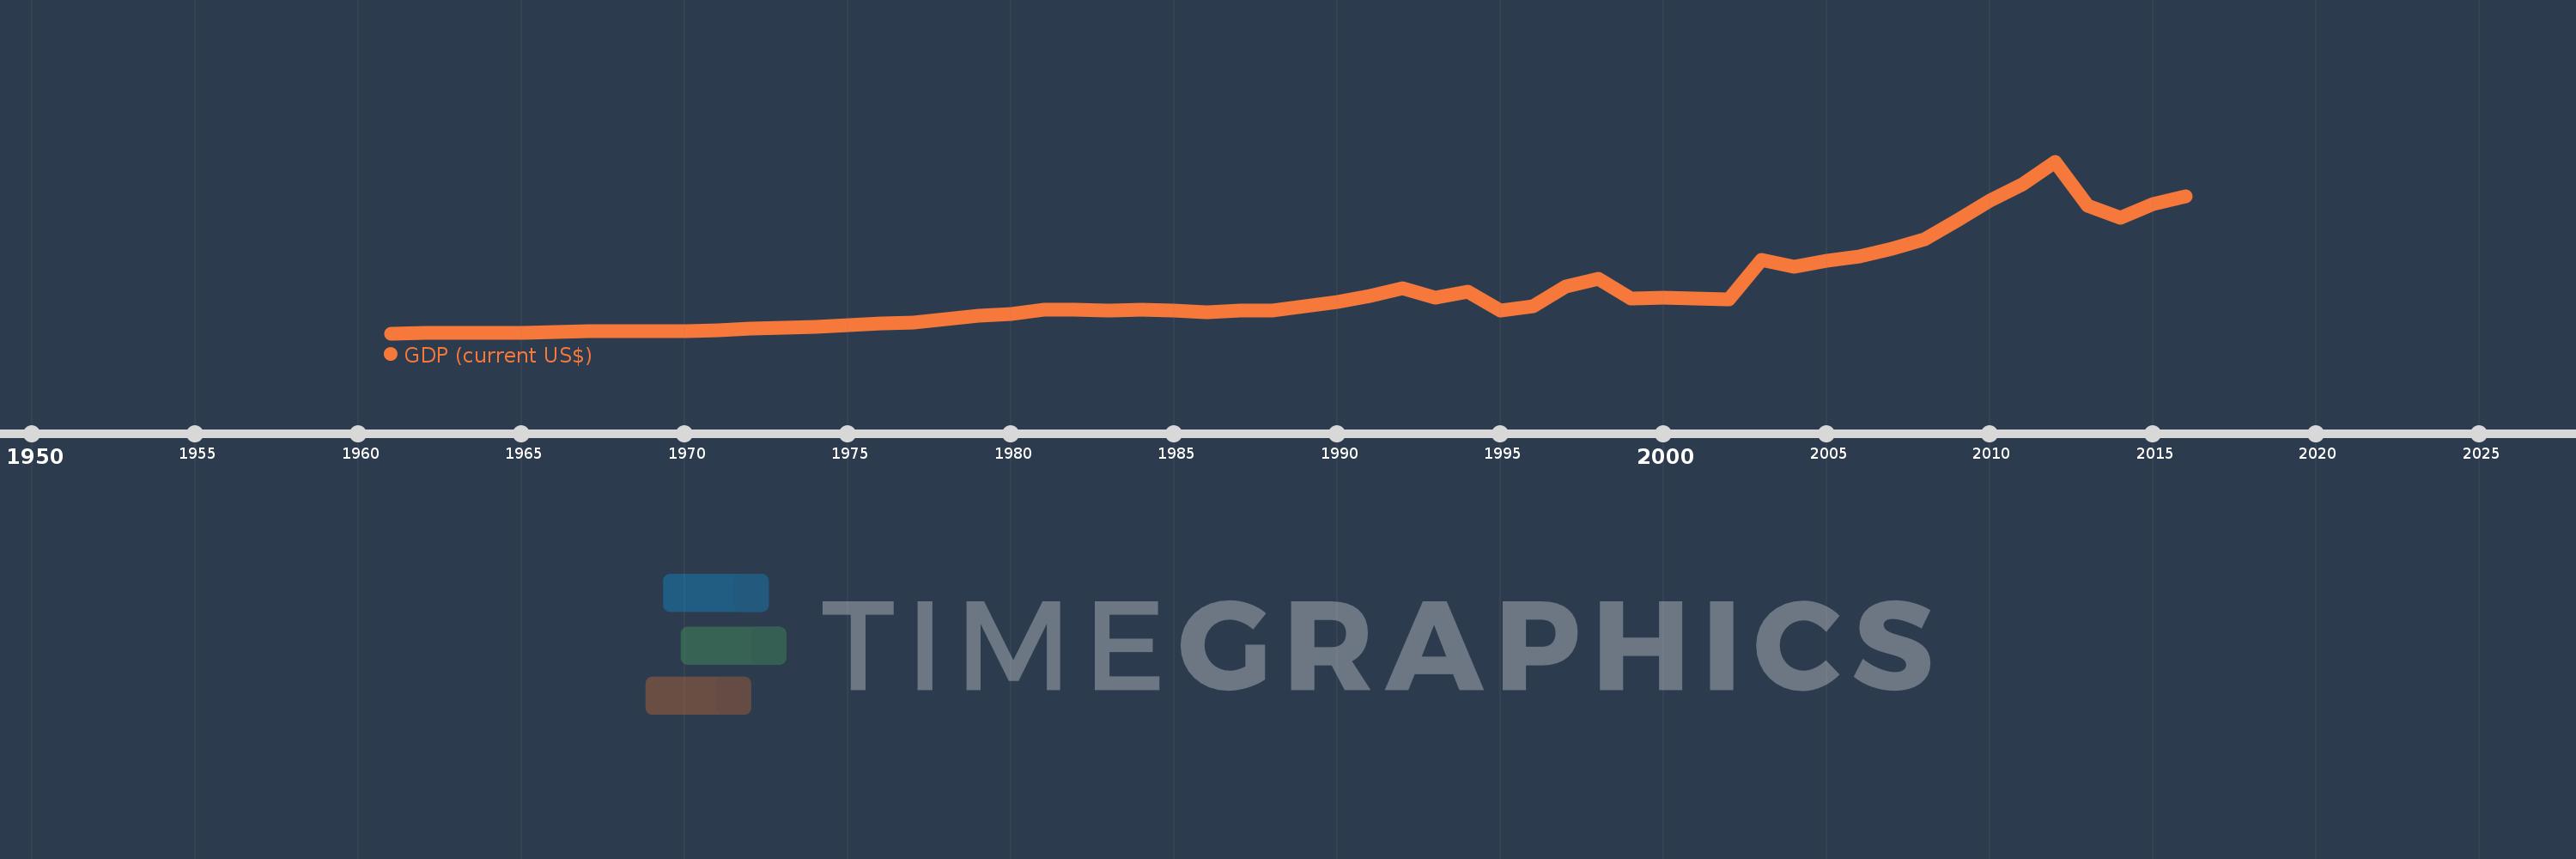
GDP (current US$)
2016,2015,2014,2013,2012,2011,2010,2009,2008,2007,2006,2005,2004,2003,2002,2001,2000,1999,1998,1997,1996,1995,1994,1993,1992,1991,1990,1989,1988,1987,1986,1985,1984,1983,1982,1981,1980,1979,1978,1977,1976,1975,1974,1973,1972,1971,1970,1969,1968,1967,1966,1965,1964,1963,1962,1961
This statistics in other country:
AfghanistanAlbaniaAlgeriaAndorraAngolaAntigua and BarbudaArab WorldArgentinaArmeniaArubaAustraliaAustriaAzerbaijanBahamas, TheBahrainBangladeshBarbadosBelarusBelgiumBelizeBeninBermudaBhutanBoliviaBosnia and HerzegovinaBotswanaBrazilBrunei DarussalamBulgariaBurkina FasoBurundiCabo VerdeCambodiaCameroonCanadaCaribbean small statesCayman IslandsCentral African RepublicCentral Europe and the BalticsChadChannel IslandsChileChinaColombiaComorosCongo, Dem. Rep.Congo, Rep.Costa RicaCote d'IvoireCroatiaCubaCyprusCzech RepublicDenmarkDjiboutiDominicaDominican RepublicEarly-demographic dividendEast Asia & PacificEast Asia & Pacific (excluding high income)East Asia & Pacific (IDA & IBRD countries)EcuadorEgypt, Arab Rep.El SalvadorEquatorial GuineaEritreaEstoniaEthiopiaEuro areaEurope & Central AsiaEurope & Central Asia (excluding high income)Europe & Central Asia (IDA & IBRD countries)European UnionFaroe IslandsFijiFinlandFragile and conflict affected situationsFranceFrench PolynesiaGabonGambia, TheGeorgiaGermanyGhanaGreeceGreenlandGrenadaGuatemalaGuineaGuinea-BissauGuyanaHaitiHeavily indebted poor countries (HIPC)High incomeHondurasHong Kong SAR, ChinaHungaryIBRD onlyIcelandIDA & IBRD totalIDA blendIDA onlyIDA totalIndiaIndonesiaIran, Islamic Rep.IraqIrelandIsle of ManIsraelItalyJamaicaJapanJordanKazakhstanKenyaKiribatiKorea, Rep.KosovoKuwaitKyrgyz RepublicLao PDRLate-demographic dividendLatin America & Caribbean Latin America & Caribbean (excluding high income)Latin America & the Caribbean (IDA & IBRD countries)LatviaLeast developed countries: UN classificationLebanonLesothoLiberiaLibyaLiechtensteinLithuaniaLow & middle incomeLow incomeLower middle incomeLuxembourgMacao SAR, ChinaMacedonia, FYRMadagascarMalawiMalaysiaMaldivesMaliMaltaMarshall IslandsMauritaniaMauritiusMexicoMicronesia, Fed. Sts.Middle East & North AfricaMiddle East & North Africa (excluding high income)Middle East & North Africa (IDA & IBRD countries)Middle incomeMoldovaMonacoMongoliaMontenegroMoroccoMozambiqueMyanmarNamibiaNauruNepalNetherlandsNew CaledoniaNew ZealandNicaraguaNigerNigeriaNorth AmericaNorwayOECD membersOmanOther small statesPacific island small statesPakistanPalauPanamaPapua New GuineaParaguayPeruPhilippinesPolandPortugalPost-demographic dividendPre-demographic dividendPuerto RicoQatarRomaniaRussian FederationRwandaSamoaSan MarinoSao Tome and PrincipeSaudi ArabiaSenegalSerbiaSeychellesSierra LeoneSingaporeSlovak RepublicSloveniaSmall statesSolomon IslandsSomaliaSouth AfricaSouth AsiaSouth Asia (IDA & IBRD)South SudanSpainSri LankaSt. Kitts and NevisSt. LuciaSt. Vincent and the GrenadinesSub-Saharan Africa Sub-Saharan Africa (excluding high income)Sub-Saharan Africa (IDA & IBRD countries)SudanSurinameSwazilandSwedenSwitzerlandSyrian Arab RepublicTajikistanTanzaniaThailandTimor-LesteTogoTongaTrinidad and TobagoTunisiaTurkeyTurkmenistanTuvaluUgandaUkraineUnited Arab EmiratesUnited KingdomUnited StatesUpper middle incomeUruguayUzbekistanVanuatuVenezuela, RBVietnamVirgin Islands (U.S.)West Bank and GazaWorldYemen, Rep.ZambiaZimbabwe Timeline:
This timeline shows a graph from 1961 to 2016 of Malawi. No data until 1960. Number of actual observations by date: 56.
Source name:
World Development Indicators
Source organization:
World Bank national accounts data, and OECD National Accounts data files.
Categories, topics:
Economy & Growth
Last updated:
apr 23, 2017
Indicators value changes by year
Minimum:
162.96 mln
jan 1, 1961
Maximum:
7.984 bln
jan 1, 2012
At the date of observation
Value
Absolute change
Change from previous value
jan 1, 1961
162.96 mln
+162.96 mln
0.0%
jan 1, 1962
174.58 mln
+11.62 mln
7.13%
jan 1, 1963
183.12 mln
+8.54 mln
4.89%
jan 1, 1964
190.82 mln
+7.7 mln
4.2%
jan 1, 1965
194.74 mln
+3.92 mln
2.05%
jan 1, 1966
229.46 mln
+34.72 mln
17.83%
jan 1, 1967
260.4 mln
+30.94 mln
13.48%
jan 1, 1968
269.813 mln
+9.413 mln
3.61%
jan 1, 1969
245.16 mln
-24.653 mln
-9.14%
jan 1, 1970
265.8 mln
+20.64 mln
8.42%
jan 1, 1971
290.52 mln
+24.72 mln
9.3%
jan 1, 1972
365.39 mln
+74.869 mln
25.77%
jan 1, 1973
406.084 mln
+40.695 mln
11.14%
jan 1, 1974
444.302 mln
+38.218 mln
9.41%
jan 1, 1975
548.619 mln
+104.317 mln
23.48%
jan 1, 1976
613.197 mln
+64.578 mln
11.77%
jan 1, 1977
670.309 mln
+57.112 mln
9.31%
jan 1, 1978
806.266 mln
+135.957 mln
20.28%
jan 1, 1979
948.983 mln
+142.718 mln
17.7%
jan 1, 1980
1.058 bln
+109.314 mln
11.52%
jan 1, 1981
1.238 bln
+179.364 mln
16.95%
jan 1, 1982
1.238 bln
+24.894K
0.0%
jan 1, 1983
1.18 bln
-57.593 mln
-4.65%
jan 1, 1984
1.223 bln
+43.131 mln
3.65%
jan 1, 1985
1.208 bln
-15.199 mln
-1.24%
jan 1, 1986
1.131 bln
-76.676 mln
-6.35%
jan 1, 1987
1.184 bln
+52.322 mln
4.62%
jan 1, 1988
1.183 bln
-600.425K
-0.05%
jan 1, 1989
1.38 bln
+196.852 mln
16.64%
jan 1, 1990
1.59 bln
+210.278 mln
15.24%
jan 1, 1991
1.881 bln
+290.583 mln
18.27%
jan 1, 1992
2.204 bln
+322.752 mln
17.16%
jan 1, 1993
1.8 bln
-404.007 mln
-18.33%
jan 1, 1994
2.071 bln
+271.118 mln
15.07%
jan 1, 1995
1.182 bln
-888.845 mln
-42.93%
jan 1, 1996
1.397 bln
+215.652 mln
18.25%
jan 1, 1997
2.281 bln
+883.585 mln
63.23%
jan 1, 1998
2.663 bln
+382.2 mln
16.76%
jan 1, 1999
1.751 bln
-912.654 mln
-34.27%
jan 1, 2000
1.776 bln
+25.335 mln
1.45%
jan 1, 2001
1.744 bln
-32.414 mln
-1.83%
jan 1, 2002
1.717 bln
-27.004 mln
-1.55%
jan 1, 2003
3.496 bln
+1.779 bln
103.65%
jan 1, 2004
3.209 bln
-286.43 mln
-8.19%
jan 1, 2005
3.476 bln
+267.166 mln
8.33%
jan 1, 2006
3.656 bln
+179.559 mln
5.17%
jan 1, 2007
3.998 bln
+342.127 mln
9.36%
jan 1, 2008
4.431 bln
+433.457 mln
10.84%
jan 1, 2009
5.321 bln
+889.637 mln
20.08%
jan 1, 2010
6.195 bln
+874.231 mln
16.43%
jan 1, 2011
6.957 bln
+762.11 mln
12.3%
jan 1, 2012
7.984 bln
+1.026 bln
14.75%
jan 1, 2013
5.981 bln
-2.003 bln
-25.09%
jan 1, 2014
5.432 bln
-548.418 mln
-9.17%
jan 1, 2015
6.055 bln
+623.083 mln
11.47%
jan 1, 2016
6.404 bln
+348.568 mln
5.76%
Ranking of countries by current statistics by years


Comments: