29
/
en
AIzaSyAYiBZKx7MnpbEhh9jyipgxe19OcubqV5w
April 1, 2024
144364
Guatemala
GTM
true
2
1
GDP (current US$)
2016,2015,2014,2013,2012,2011,2010,2009,2008,2007,2006,2005,2004,2003,2002,2001,2000,1999,1998,1997,1996,1995,1994,1993,1992,1991,1990,1989,1988,1987,1986,1985,1984,1983,1982,1981,1980,1979,1978,1977,1976,1975,1974,1973,1972,1971,1970,1969,1968,1967,1966,1965,1964,1963,1962,1961
This statistics in other country:
AfghanistanAlbaniaAlgeriaAndorraAngolaAntigua and BarbudaArab WorldArgentinaArmeniaArubaAustraliaAustriaAzerbaijanBahamas, TheBahrainBangladeshBarbadosBelarusBelgiumBelizeBeninBermudaBhutanBoliviaBosnia and HerzegovinaBotswanaBrazilBrunei DarussalamBulgariaBurkina FasoBurundiCabo VerdeCambodiaCameroonCanadaCaribbean small statesCayman IslandsCentral African RepublicCentral Europe and the BalticsChadChannel IslandsChileChinaColombiaComorosCongo, Dem. Rep.Congo, Rep.Costa RicaCote d'IvoireCroatiaCubaCyprusCzech RepublicDenmarkDjiboutiDominicaDominican RepublicEarly-demographic dividendEast Asia & PacificEast Asia & Pacific (excluding high income)East Asia & Pacific (IDA & IBRD countries)EcuadorEgypt, Arab Rep.El SalvadorEquatorial GuineaEritreaEstoniaEthiopiaEuro areaEurope & Central AsiaEurope & Central Asia (excluding high income)Europe & Central Asia (IDA & IBRD countries)European UnionFaroe IslandsFijiFinlandFragile and conflict affected situationsFranceFrench PolynesiaGabonGambia, TheGeorgiaGermanyGhanaGreeceGreenlandGrenadaGuatemalaGuineaGuinea-BissauGuyanaHaitiHeavily indebted poor countries (HIPC)High incomeHondurasHong Kong SAR, ChinaHungaryIBRD onlyIcelandIDA & IBRD totalIDA blendIDA onlyIDA totalIndiaIndonesiaIran, Islamic Rep.IraqIrelandIsle of ManIsraelItalyJamaicaJapanJordanKazakhstanKenyaKiribatiKorea, Rep.KosovoKuwaitKyrgyz RepublicLao PDRLate-demographic dividendLatin America & Caribbean Latin America & Caribbean (excluding high income)Latin America & the Caribbean (IDA & IBRD countries)LatviaLeast developed countries: UN classificationLebanonLesothoLiberiaLibyaLiechtensteinLithuaniaLow & middle incomeLow incomeLower middle incomeLuxembourgMacao SAR, ChinaMacedonia, FYRMadagascarMalawiMalaysiaMaldivesMaliMaltaMarshall IslandsMauritaniaMauritiusMexicoMicronesia, Fed. Sts.Middle East & North AfricaMiddle East & North Africa (excluding high income)Middle East & North Africa (IDA & IBRD countries)Middle incomeMoldovaMonacoMongoliaMontenegroMoroccoMozambiqueMyanmarNamibiaNauruNepalNetherlandsNew CaledoniaNew ZealandNicaraguaNigerNigeriaNorth AmericaNorwayOECD membersOmanOther small statesPacific island small statesPakistanPalauPanamaPapua New GuineaParaguayPeruPhilippinesPolandPortugalPost-demographic dividendPre-demographic dividendPuerto RicoQatarRomaniaRussian FederationRwandaSamoaSan MarinoSao Tome and PrincipeSaudi ArabiaSenegalSerbiaSeychellesSierra LeoneSingaporeSlovak RepublicSloveniaSmall statesSolomon IslandsSomaliaSouth AfricaSouth AsiaSouth Asia (IDA & IBRD)South SudanSpainSri LankaSt. Kitts and NevisSt. LuciaSt. Vincent and the GrenadinesSub-Saharan Africa Sub-Saharan Africa (excluding high income)Sub-Saharan Africa (IDA & IBRD countries)SudanSurinameSwazilandSwedenSwitzerlandSyrian Arab RepublicTajikistanTanzaniaThailandTimor-LesteTogoTongaTrinidad and TobagoTunisiaTurkeyTurkmenistanTuvaluUgandaUkraineUnited Arab EmiratesUnited KingdomUnited StatesUpper middle incomeUruguayUzbekistanVanuatuVenezuela, RBVietnamVirgin Islands (U.S.)West Bank and GazaWorldYemen, Rep.ZambiaZimbabwe Timeline:
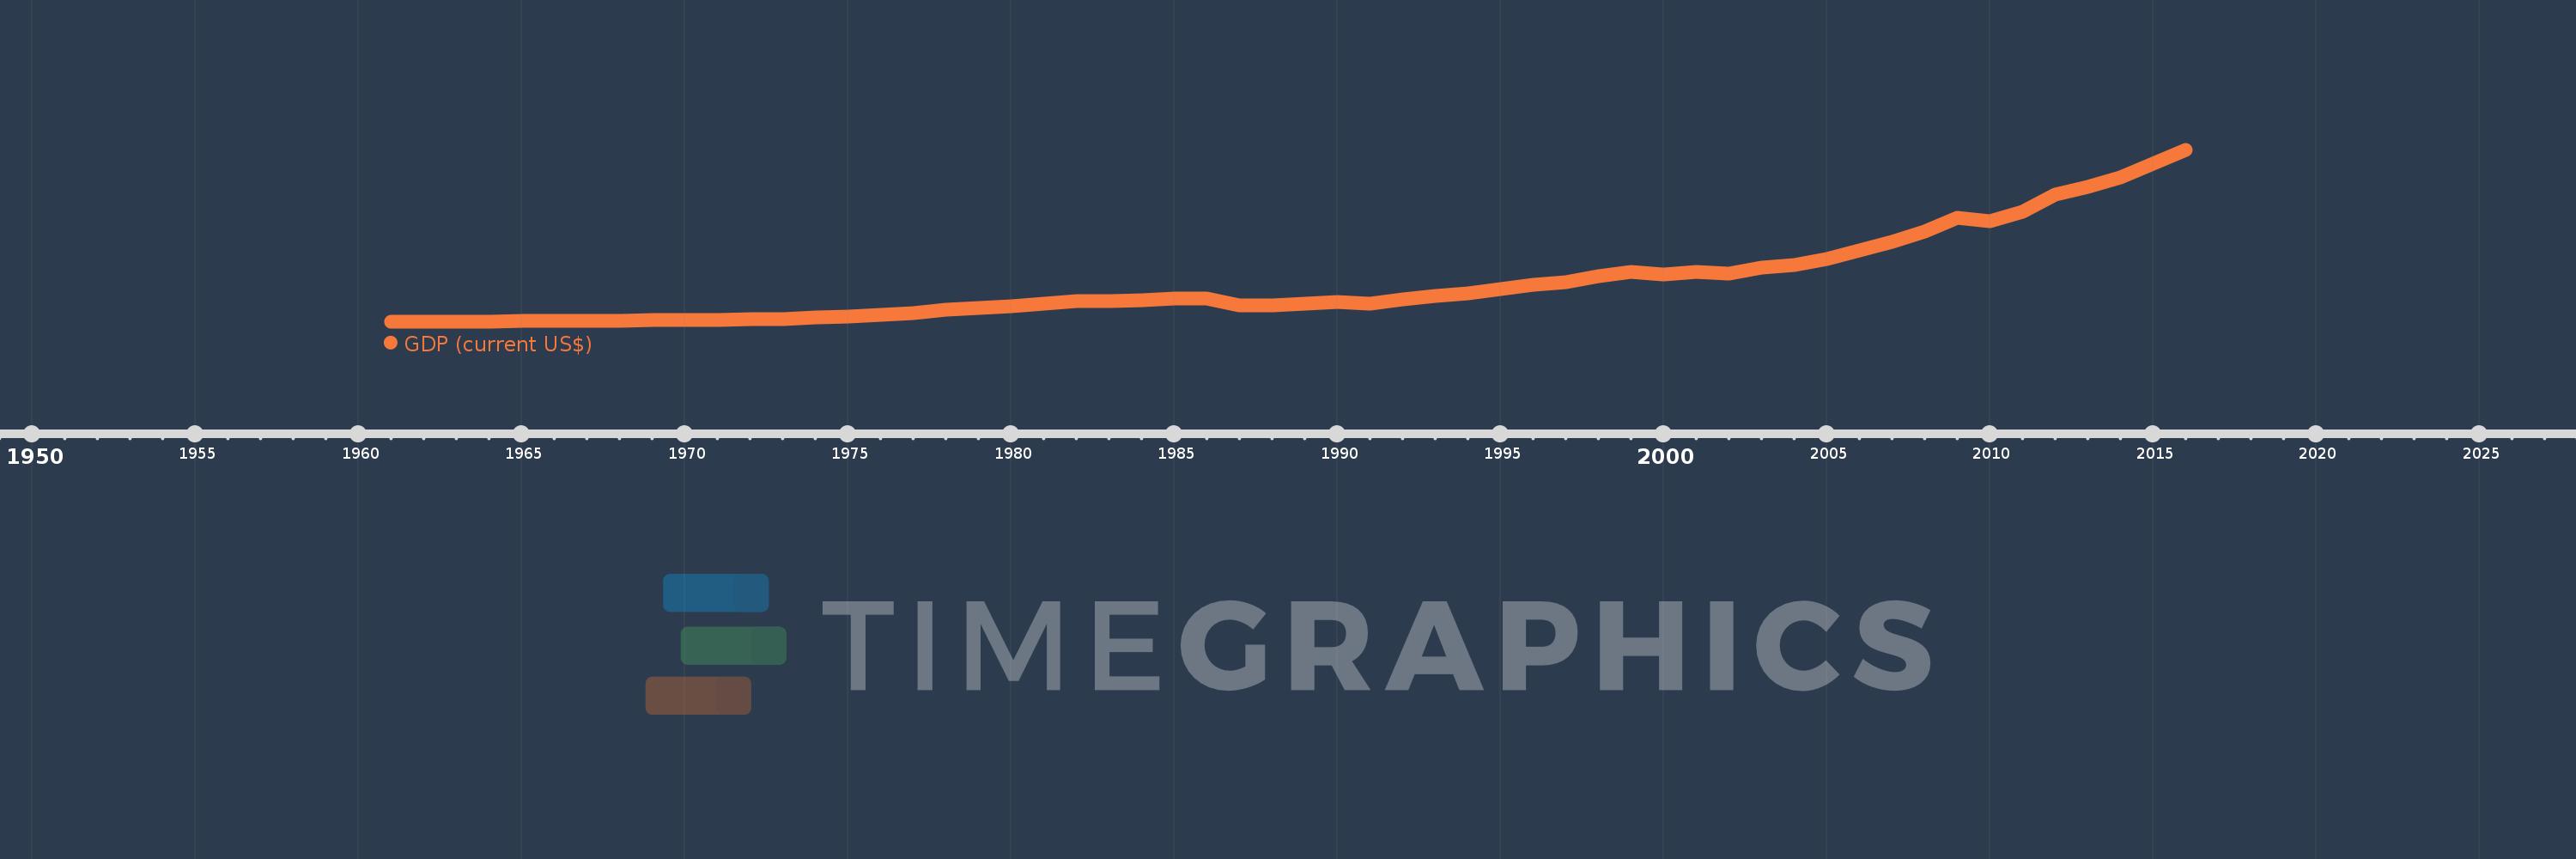
This timeline shows a graph from 1961 to 2016 of Guatemala. No data until 1960. Number of actual observations by date: 56.
Source name:
World Development Indicators
Source organization:
World Bank national accounts data, and OECD National Accounts data files.
Categories, topics:
Economy & Growth
Last updated:
apr 23, 2017
Indicators value changes by year
Minimum:
1.044 bln
jan 1, 1961
Maximum:
63.794 bln
jan 1, 2016
At the date of observation
Value
Absolute change
Change from previous value
jan 1, 1961
1.044 bln
+1.044 bln
0.0%
jan 1, 1962
1.077 bln
+33.1 mln
3.17%
jan 1, 1963
1.144 bln
+66.9 mln
6.21%
jan 1, 1964
1.263 bln
+119.2 mln
10.42%
jan 1, 1965
1.299 bln
+36.3 mln
2.87%
jan 1, 1966
1.331 bln
+32.3 mln
2.49%
jan 1, 1967
1.391 bln
+59.3 mln
4.45%
jan 1, 1968
1.454 bln
+62.8 mln
4.52%
jan 1, 1969
1.611 bln
+157.0 mln
10.8%
jan 1, 1970
1.715 bln
+104.9 mln
6.51%
jan 1, 1971
1.904 bln
+188.6 mln
10.99%
jan 1, 1972
1.985 bln
+80.8 mln
4.24%
jan 1, 1973
2.101 bln
+116.5 mln
5.87%
jan 1, 1974
2.569 bln
+467.9 mln
22.27%
jan 1, 1975
3.161 bln
+592.3 mln
23.05%
jan 1, 1976
3.646 bln
+484.4 mln
15.32%
jan 1, 1977
4.365 bln
+719.4 mln
19.73%
jan 1, 1978
5.481 bln
+1.115 bln
25.55%
jan 1, 1979
6.071 bln
+590.1 mln
10.77%
jan 1, 1980
6.903 bln
+832.0 mln
13.71%
jan 1, 1981
7.879 bln
+976.1 mln
14.14%
jan 1, 1982
8.608 bln
+728.8 mln
9.25%
jan 1, 1983
8.717 bln
+109.499 mln
1.27%
jan 1, 1984
9.05 bln
+333.001 mln
3.82%
jan 1, 1985
9.47 bln
+420.0 mln
4.64%
jan 1, 1986
9.722 bln
+251.652 mln
2.66%
jan 1, 1987
7.232 bln
-2.49 bln
-25.61%
jan 1, 1988
7.084 bln
-147.564 mln
-2.04%
jan 1, 1989
7.842 bln
+757.203 mln
10.69%
jan 1, 1990
8.411 bln
+569.122 mln
7.26%
jan 1, 1991
7.65 bln
-760.599 mln
-9.04%
jan 1, 1992
9.406 bln
+1.756 bln
22.95%
jan 1, 1993
10.441 bln
+1.035 bln
11.0%
jan 1, 1994
11.4 bln
+959.1 mln
9.19%
jan 1, 1995
12.983 bln
+1.583 bln
13.89%
jan 1, 1996
14.655 bln
+1.672 bln
12.88%
jan 1, 1997
15.675 bln
+1.019 bln
6.96%
jan 1, 1998
17.79 bln
+2.115 bln
13.49%
jan 1, 1999
19.395 bln
+1.605 bln
9.02%
jan 1, 2000
18.319 bln
-1.077 bln
-5.55%
jan 1, 2001
19.289 bln
+970.414 mln
5.3%
jan 1, 2002
18.703 bln
-586.104 mln
-3.04%
jan 1, 2003
20.777 bln
+2.074 bln
11.09%
jan 1, 2004
21.918 bln
+1.141 bln
5.49%
jan 1, 2005
23.965 bln
+2.048 bln
9.34%
jan 1, 2006
27.211 bln
+3.246 bln
13.54%
jan 1, 2007
30.231 bln
+3.02 bln
11.1%
jan 1, 2008
34.113 bln
+3.882 bln
12.84%
jan 1, 2009
39.137 bln
+5.024 bln
14.73%
jan 1, 2010
37.734 bln
-1.403 bln
-3.59%
jan 1, 2011
41.338 bln
+3.604 bln
9.55%
jan 1, 2012
47.655 bln
+6.316 bln
15.28%
jan 1, 2013
50.388 bln
+2.734 bln
5.74%
jan 1, 2014
53.851 bln
+3.463 bln
6.87%
jan 1, 2015
58.722 bln
+4.871 bln
9.05%
jan 1, 2016
63.794 bln
+5.072 bln
8.64%
Ranking of countries by current statistics by years


Comments: