29
/
en
AIzaSyAYiBZKx7MnpbEhh9jyipgxe19OcubqV5w
April 1, 2024
113578
Cote d'Ivoire
CIV
true
2
1
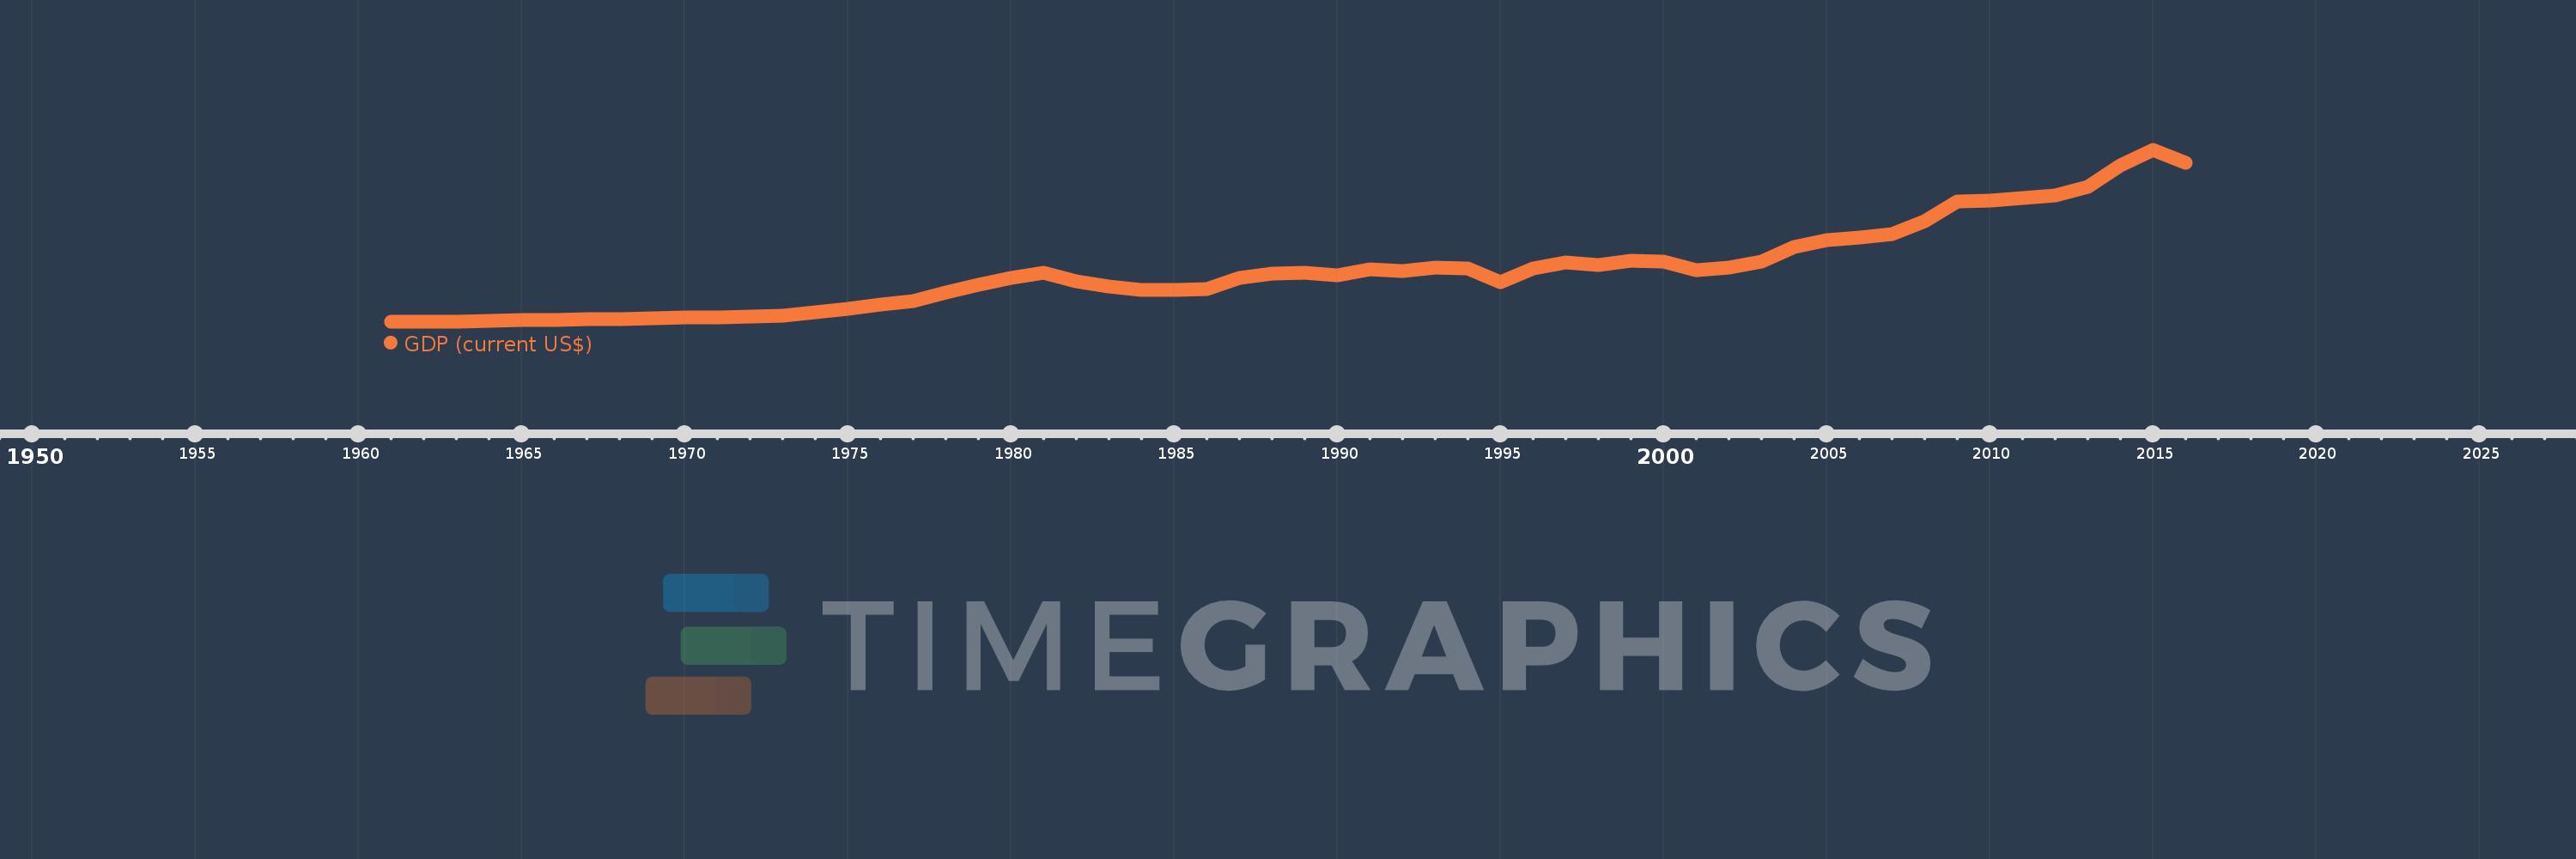
GDP (current US$)
2016,2015,2014,2013,2012,2011,2010,2009,2008,2007,2006,2005,2004,2003,2002,2001,2000,1999,1998,1997,1996,1995,1994,1993,1992,1991,1990,1989,1988,1987,1986,1985,1984,1983,1982,1981,1980,1979,1978,1977,1976,1975,1974,1973,1972,1971,1970,1969,1968,1967,1966,1965,1964,1963,1962,1961
This statistics in other country:
AfghanistanAlbaniaAlgeriaAndorraAngolaAntigua and BarbudaArab WorldArgentinaArmeniaArubaAustraliaAustriaAzerbaijanBahamas, TheBahrainBangladeshBarbadosBelarusBelgiumBelizeBeninBermudaBhutanBoliviaBosnia and HerzegovinaBotswanaBrazilBrunei DarussalamBulgariaBurkina FasoBurundiCabo VerdeCambodiaCameroonCanadaCaribbean small statesCayman IslandsCentral African RepublicCentral Europe and the BalticsChadChannel IslandsChileChinaColombiaComorosCongo, Dem. Rep.Congo, Rep.Costa RicaCote d'IvoireCroatiaCubaCyprusCzech RepublicDenmarkDjiboutiDominicaDominican RepublicEarly-demographic dividendEast Asia & PacificEast Asia & Pacific (excluding high income)East Asia & Pacific (IDA & IBRD countries)EcuadorEgypt, Arab Rep.El SalvadorEquatorial GuineaEritreaEstoniaEthiopiaEuro areaEurope & Central AsiaEurope & Central Asia (excluding high income)Europe & Central Asia (IDA & IBRD countries)European UnionFaroe IslandsFijiFinlandFragile and conflict affected situationsFranceFrench PolynesiaGabonGambia, TheGeorgiaGermanyGhanaGreeceGreenlandGrenadaGuatemalaGuineaGuinea-BissauGuyanaHaitiHeavily indebted poor countries (HIPC)High incomeHondurasHong Kong SAR, ChinaHungaryIBRD onlyIcelandIDA & IBRD totalIDA blendIDA onlyIDA totalIndiaIndonesiaIran, Islamic Rep.IraqIrelandIsle of ManIsraelItalyJamaicaJapanJordanKazakhstanKenyaKiribatiKorea, Rep.KosovoKuwaitKyrgyz RepublicLao PDRLate-demographic dividendLatin America & Caribbean Latin America & Caribbean (excluding high income)Latin America & the Caribbean (IDA & IBRD countries)LatviaLeast developed countries: UN classificationLebanonLesothoLiberiaLibyaLiechtensteinLithuaniaLow & middle incomeLow incomeLower middle incomeLuxembourgMacao SAR, ChinaMacedonia, FYRMadagascarMalawiMalaysiaMaldivesMaliMaltaMarshall IslandsMauritaniaMauritiusMexicoMicronesia, Fed. Sts.Middle East & North AfricaMiddle East & North Africa (excluding high income)Middle East & North Africa (IDA & IBRD countries)Middle incomeMoldovaMonacoMongoliaMontenegroMoroccoMozambiqueMyanmarNamibiaNauruNepalNetherlandsNew CaledoniaNew ZealandNicaraguaNigerNigeriaNorth AmericaNorwayOECD membersOmanOther small statesPacific island small statesPakistanPalauPanamaPapua New GuineaParaguayPeruPhilippinesPolandPortugalPost-demographic dividendPre-demographic dividendPuerto RicoQatarRomaniaRussian FederationRwandaSamoaSan MarinoSao Tome and PrincipeSaudi ArabiaSenegalSerbiaSeychellesSierra LeoneSingaporeSlovak RepublicSloveniaSmall statesSolomon IslandsSomaliaSouth AfricaSouth AsiaSouth Asia (IDA & IBRD)South SudanSpainSri LankaSt. Kitts and NevisSt. LuciaSt. Vincent and the GrenadinesSub-Saharan Africa Sub-Saharan Africa (excluding high income)Sub-Saharan Africa (IDA & IBRD countries)SudanSurinameSwazilandSwedenSwitzerlandSyrian Arab RepublicTajikistanTanzaniaThailandTimor-LesteTogoTongaTrinidad and TobagoTunisiaTurkeyTurkmenistanTuvaluUgandaUkraineUnited Arab EmiratesUnited KingdomUnited StatesUpper middle incomeUruguayUzbekistanVanuatuVenezuela, RBVietnamVirgin Islands (U.S.)West Bank and GazaWorldYemen, Rep.ZambiaZimbabwe Timeline:
This timeline shows a graph from 1961 to 2016 of Cote d'Ivoire. No data until 1960. Number of actual observations by date: 56.
Source name:
World Development Indicators
Source organization:
World Bank national accounts data, and OECD National Accounts data files.
Categories, topics:
Economy & Growth
Last updated:
apr 23, 2017
Indicators value changes by year
Minimum:
546.204 mln
jan 1, 1961
Maximum:
34.218 bln
jan 1, 2015
At the date of observation
Value
Absolute change
Change from previous value
jan 1, 1961
546.204 mln
+546.204 mln
0.0%
jan 1, 1962
618.246 mln
+72.042 mln
13.19%
jan 1, 1963
645.284 mln
+27.039 mln
4.37%
jan 1, 1964
761.047 mln
+115.763 mln
17.94%
jan 1, 1965
921.063 mln
+160.016 mln
21.03%
jan 1, 1966
919.771 mln
-1.292 mln
-0.14%
jan 1, 1967
1.024 bln
+104.332 mln
11.34%
jan 1, 1968
1.083 bln
+58.82 mln
5.74%
jan 1, 1969
1.281 bln
+198.358 mln
18.32%
jan 1, 1970
1.361 bln
+80.079 mln
6.25%
jan 1, 1971
1.455 bln
+94.123 mln
6.91%
jan 1, 1972
1.584 bln
+128.645 mln
8.84%
jan 1, 1973
1.849 bln
+265.272 mln
16.75%
jan 1, 1974
2.508 bln
+659.021 mln
35.63%
jan 1, 1975
3.07 bln
+561.731 mln
22.39%
jan 1, 1976
3.894 bln
+823.687 mln
26.83%
jan 1, 1977
4.662 bln
+768.215 mln
19.73%
jan 1, 1978
6.265 bln
+1.603 bln
34.38%
jan 1, 1979
7.901 bln
+1.635 bln
26.1%
jan 1, 1980
9.143 bln
+1.242 bln
15.73%
jan 1, 1981
10.176 bln
+1.033 bln
11.29%
jan 1, 1982
8.433 bln
-1.743 bln
-17.13%
jan 1, 1983
7.567 bln
-865.479 mln
-10.26%
jan 1, 1984
6.838 bln
-728.924 mln
-9.63%
jan 1, 1985
6.842 bln
+3.453 mln
0.05%
jan 1, 1986
6.978 bln
+136.011 mln
1.99%
jan 1, 1987
9.158 bln
+2.181 bln
31.25%
jan 1, 1988
10.088 bln
+929.351 mln
10.15%
jan 1, 1989
10.255 bln
+167.517 mln
1.66%
jan 1, 1990
9.757 bln
-497.76 mln
-4.85%
jan 1, 1991
10.796 bln
+1.038 bln
10.64%
jan 1, 1992
10.493 bln
-303.221 mln
-2.81%
jan 1, 1993
11.153 bln
+660.342 mln
6.29%
jan 1, 1994
11.046 bln
-107.212 mln
-0.96%
jan 1, 1995
8.314 bln
-2.732 bln
-24.74%
jan 1, 1996
11.0 bln
+2.687 bln
32.32%
jan 1, 1997
12.139 bln
+1.139 bln
10.36%
jan 1, 1998
11.722 bln
-417.092 mln
-3.44%
jan 1, 1999
12.612 bln
+889.891 mln
7.59%
jan 1, 2000
12.377 bln
-235.394 mln
-1.87%
jan 1, 2001
10.717 bln
-1.66 bln
-13.41%
jan 1, 2002
11.193 bln
+475.538 mln
4.44%
jan 1, 2003
12.347 bln
+1.154 bln
10.31%
jan 1, 2004
15.307 bln
+2.96 bln
23.97%
jan 1, 2005
16.554 bln
+1.248 bln
8.15%
jan 1, 2006
17.085 bln
+530.487 mln
3.2%
jan 1, 2007
17.801 bln
+715.959 mln
4.19%
jan 1, 2008
20.344 bln
+2.543 bln
14.28%
jan 1, 2009
24.225 bln
+3.881 bln
19.08%
jan 1, 2010
24.277 bln
+52.591 mln
0.22%
jan 1, 2011
24.885 bln
+607.011 mln
2.5%
jan 1, 2012
25.382 bln
+497.112 mln
2.0%
jan 1, 2013
27.041 bln
+1.659 bln
6.54%
jan 1, 2014
31.264 bln
+4.224 bln
15.62%
jan 1, 2015
34.218 bln
+2.954 bln
9.45%
jan 1, 2016
31.759 bln
-2.458 bln
-7.18%
Ranking of countries by current statistics by years


Comments: