29
/
en
AIzaSyAYiBZKx7MnpbEhh9jyipgxe19OcubqV5w
April 1, 2024
171696
Kuwait
KWT
true
2
1
GDP (current US$)
2016,2015,2014,2013,2012,2011,2010,2009,2008,2007,2006,2005,2004,2003,2002,2001,2000,1999,1998,1997,1996,1995,1994,1993,1992,1991,1990,1989,1988,1987,1986,1985,1984,1983,1982,1981,1980,1979,1978,1977,1976,1975,1974,1973,1972,1971,1970,1969,1968,1967,1966
This statistics in other country:
AfghanistanAlbaniaAlgeriaAndorraAngolaAntigua and BarbudaArab WorldArgentinaArmeniaArubaAustraliaAustriaAzerbaijanBahamas, TheBahrainBangladeshBarbadosBelarusBelgiumBelizeBeninBermudaBhutanBoliviaBosnia and HerzegovinaBotswanaBrazilBrunei DarussalamBulgariaBurkina FasoBurundiCabo VerdeCambodiaCameroonCanadaCaribbean small statesCayman IslandsCentral African RepublicCentral Europe and the BalticsChadChannel IslandsChileChinaColombiaComorosCongo, Dem. Rep.Congo, Rep.Costa RicaCote d'IvoireCroatiaCubaCyprusCzech RepublicDenmarkDjiboutiDominicaDominican RepublicEarly-demographic dividendEast Asia & PacificEast Asia & Pacific (excluding high income)East Asia & Pacific (IDA & IBRD countries)EcuadorEgypt, Arab Rep.El SalvadorEquatorial GuineaEritreaEstoniaEthiopiaEuro areaEurope & Central AsiaEurope & Central Asia (excluding high income)Europe & Central Asia (IDA & IBRD countries)European UnionFaroe IslandsFijiFinlandFragile and conflict affected situationsFranceFrench PolynesiaGabonGambia, TheGeorgiaGermanyGhanaGreeceGreenlandGrenadaGuatemalaGuineaGuinea-BissauGuyanaHaitiHeavily indebted poor countries (HIPC)High incomeHondurasHong Kong SAR, ChinaHungaryIBRD onlyIcelandIDA & IBRD totalIDA blendIDA onlyIDA totalIndiaIndonesiaIran, Islamic Rep.IraqIrelandIsle of ManIsraelItalyJamaicaJapanJordanKazakhstanKenyaKiribatiKorea, Rep.KosovoKuwaitKyrgyz RepublicLao PDRLate-demographic dividendLatin America & Caribbean Latin America & Caribbean (excluding high income)Latin America & the Caribbean (IDA & IBRD countries)LatviaLeast developed countries: UN classificationLebanonLesothoLiberiaLibyaLiechtensteinLithuaniaLow & middle incomeLow incomeLower middle incomeLuxembourgMacao SAR, ChinaMacedonia, FYRMadagascarMalawiMalaysiaMaldivesMaliMaltaMarshall IslandsMauritaniaMauritiusMexicoMicronesia, Fed. Sts.Middle East & North AfricaMiddle East & North Africa (excluding high income)Middle East & North Africa (IDA & IBRD countries)Middle incomeMoldovaMonacoMongoliaMontenegroMoroccoMozambiqueMyanmarNamibiaNauruNepalNetherlandsNew CaledoniaNew ZealandNicaraguaNigerNigeriaNorth AmericaNorwayOECD membersOmanOther small statesPacific island small statesPakistanPalauPanamaPapua New GuineaParaguayPeruPhilippinesPolandPortugalPost-demographic dividendPre-demographic dividendPuerto RicoQatarRomaniaRussian FederationRwandaSamoaSan MarinoSao Tome and PrincipeSaudi ArabiaSenegalSerbiaSeychellesSierra LeoneSingaporeSlovak RepublicSloveniaSmall statesSolomon IslandsSomaliaSouth AfricaSouth AsiaSouth Asia (IDA & IBRD)South SudanSpainSri LankaSt. Kitts and NevisSt. LuciaSt. Vincent and the GrenadinesSub-Saharan Africa Sub-Saharan Africa (excluding high income)Sub-Saharan Africa (IDA & IBRD countries)SudanSurinameSwazilandSwedenSwitzerlandSyrian Arab RepublicTajikistanTanzaniaThailandTimor-LesteTogoTongaTrinidad and TobagoTunisiaTurkeyTurkmenistanTuvaluUgandaUkraineUnited Arab EmiratesUnited KingdomUnited StatesUpper middle incomeUruguayUzbekistanVanuatuVenezuela, RBVietnamVirgin Islands (U.S.)West Bank and GazaWorldYemen, Rep.ZambiaZimbabwe Timeline:
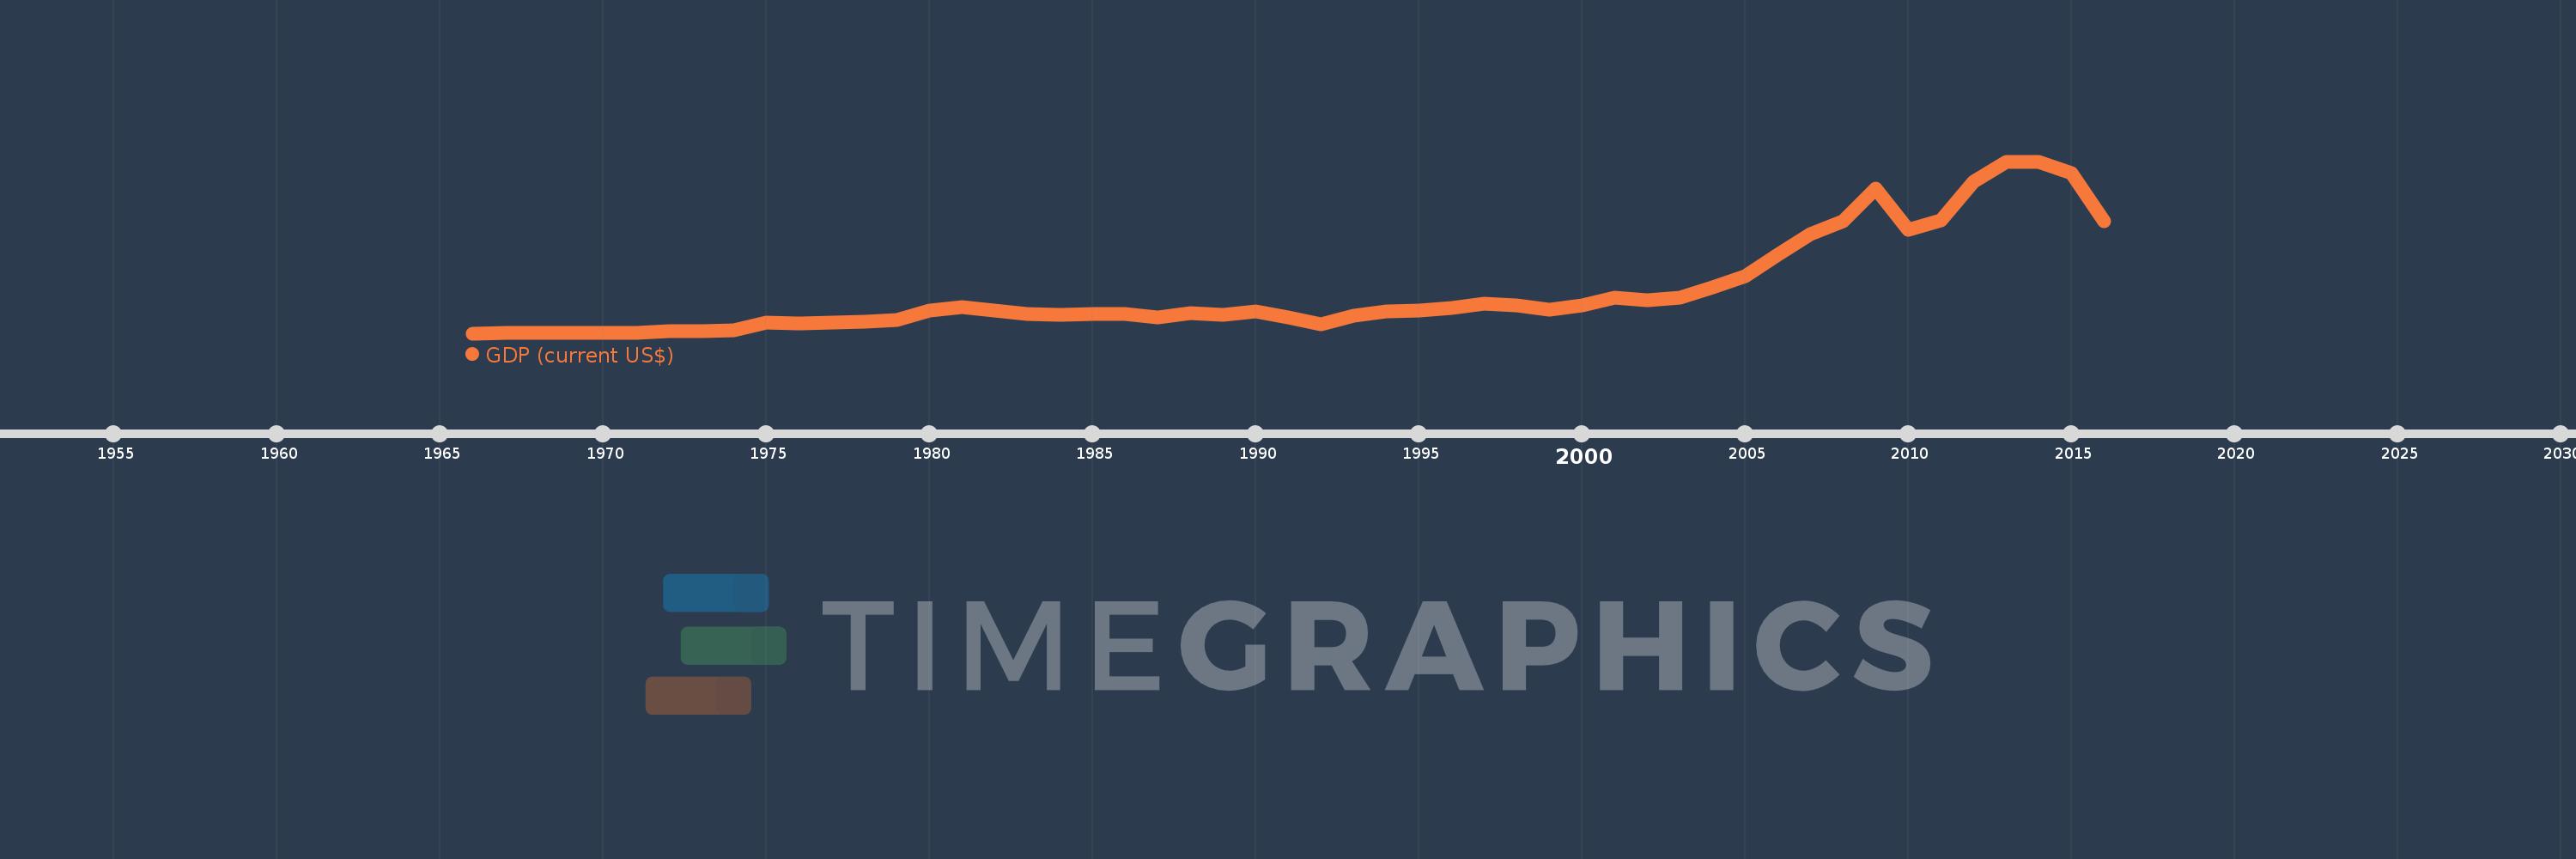
This timeline shows a graph from 1966 to 2016 of Kuwait. No data until 1965. Number of actual observations by date: 51.
Source name:
World Development Indicators
Source organization:
World Bank national accounts data, and OECD National Accounts data files.
Categories, topics:
Economy & Growth
Last updated:
apr 23, 2017
Indicators value changes by year
Minimum:
2.097 bln
jan 1, 1966
Maximum:
174.161 bln
jan 1, 2014
At the date of observation
Value
Absolute change
Change from previous value
jan 1, 1966
2.097 bln
+2.097 bln
0.0%
jan 1, 1967
2.391 bln
+294.035 mln
14.02%
jan 1, 1968
2.442 bln
+50.406 mln
2.11%
jan 1, 1969
2.663 bln
+221.227 mln
9.06%
jan 1, 1970
2.77 bln
+106.413 mln
4.0%
jan 1, 1971
2.874 bln
+104.453 mln
3.77%
jan 1, 1972
3.88 bln
+1.006 bln
35.02%
jan 1, 1973
4.451 bln
+570.831 mln
14.71%
jan 1, 1974
5.408 bln
+957.093 mln
21.5%
jan 1, 1975
13.005 bln
+7.596 bln
140.46%
jan 1, 1976
12.024 bln
-980.636 mln
-7.54%
jan 1, 1977
13.132 bln
+1.108 bln
9.21%
jan 1, 1978
14.136 bln
+1.004 bln
7.65%
jan 1, 1979
15.501 bln
+1.365 bln
9.66%
jan 1, 1980
24.746 bln
+9.245 bln
59.64%
jan 1, 1981
28.639 bln
+3.893 bln
15.73%
jan 1, 1982
25.057 bln
-3.582 bln
-12.51%
jan 1, 1983
21.578 bln
-3.479 bln
-13.88%
jan 1, 1984
20.869 bln
-708.543 mln
-3.28%
jan 1, 1985
21.697 bln
+827.864 mln
3.97%
jan 1, 1986
21.443 bln
-254.678 mln
-1.17%
jan 1, 1987
17.904 bln
-3.539 bln
-16.5%
jan 1, 1988
22.366 bln
+4.462 bln
24.92%
jan 1, 1989
20.692 bln
-1.673 bln
-7.48%
jan 1, 1990
24.312 bln
+3.62 bln
17.49%
jan 1, 1991
18.428 bln
-5.884 bln
-24.2%
jan 1, 1992
11.009 bln
-7.419 bln
-40.26%
jan 1, 1993
19.859 bln
+8.85 bln
80.39%
jan 1, 1994
23.941 bln
+4.083 bln
20.56%
jan 1, 1995
24.848 bln
+907.092 mln
3.79%
jan 1, 1996
27.192 bln
+2.343 bln
9.43%
jan 1, 1997
31.494 bln
+4.302 bln
15.82%
jan 1, 1998
30.354 bln
-1.14 bln
-3.62%
jan 1, 1999
25.942 bln
-4.413 bln
-14.54%
jan 1, 2000
30.122 bln
+4.18 bln
16.11%
jan 1, 2001
37.712 bln
+7.59 bln
25.2%
jan 1, 2002
34.891 bln
-2.821 bln
-7.48%
jan 1, 2003
38.138 bln
+3.247 bln
9.31%
jan 1, 2004
47.876 bln
+9.738 bln
25.53%
jan 1, 2005
59.44 bln
+11.564 bln
24.15%
jan 1, 2006
80.798 bln
+21.358 bln
35.93%
jan 1, 2007
101.551 bln
+20.753 bln
25.68%
jan 1, 2008
114.641 bln
+13.09 bln
12.89%
jan 1, 2009
147.396 bln
+32.755 bln
28.57%
jan 1, 2010
105.9 bln
-41.496 bln
-28.15%
jan 1, 2011
115.419 bln
+9.519 bln
8.99%
jan 1, 2012
154.028 bln
+38.608 bln
33.45%
jan 1, 2013
174.07 bln
+20.042 bln
13.01%
jan 1, 2014
174.161 bln
+91.47 mln
0.05%
jan 1, 2015
162.632 bln
-11.53 bln
-6.62%
jan 1, 2016
114.041 bln
-48.591 bln
-29.88%
Ranking of countries by current statistics by years


Comments: