29
/
en
AIzaSyAYiBZKx7MnpbEhh9jyipgxe19OcubqV5w
April 1, 2024
217481
Palau
PLW
true
2
1
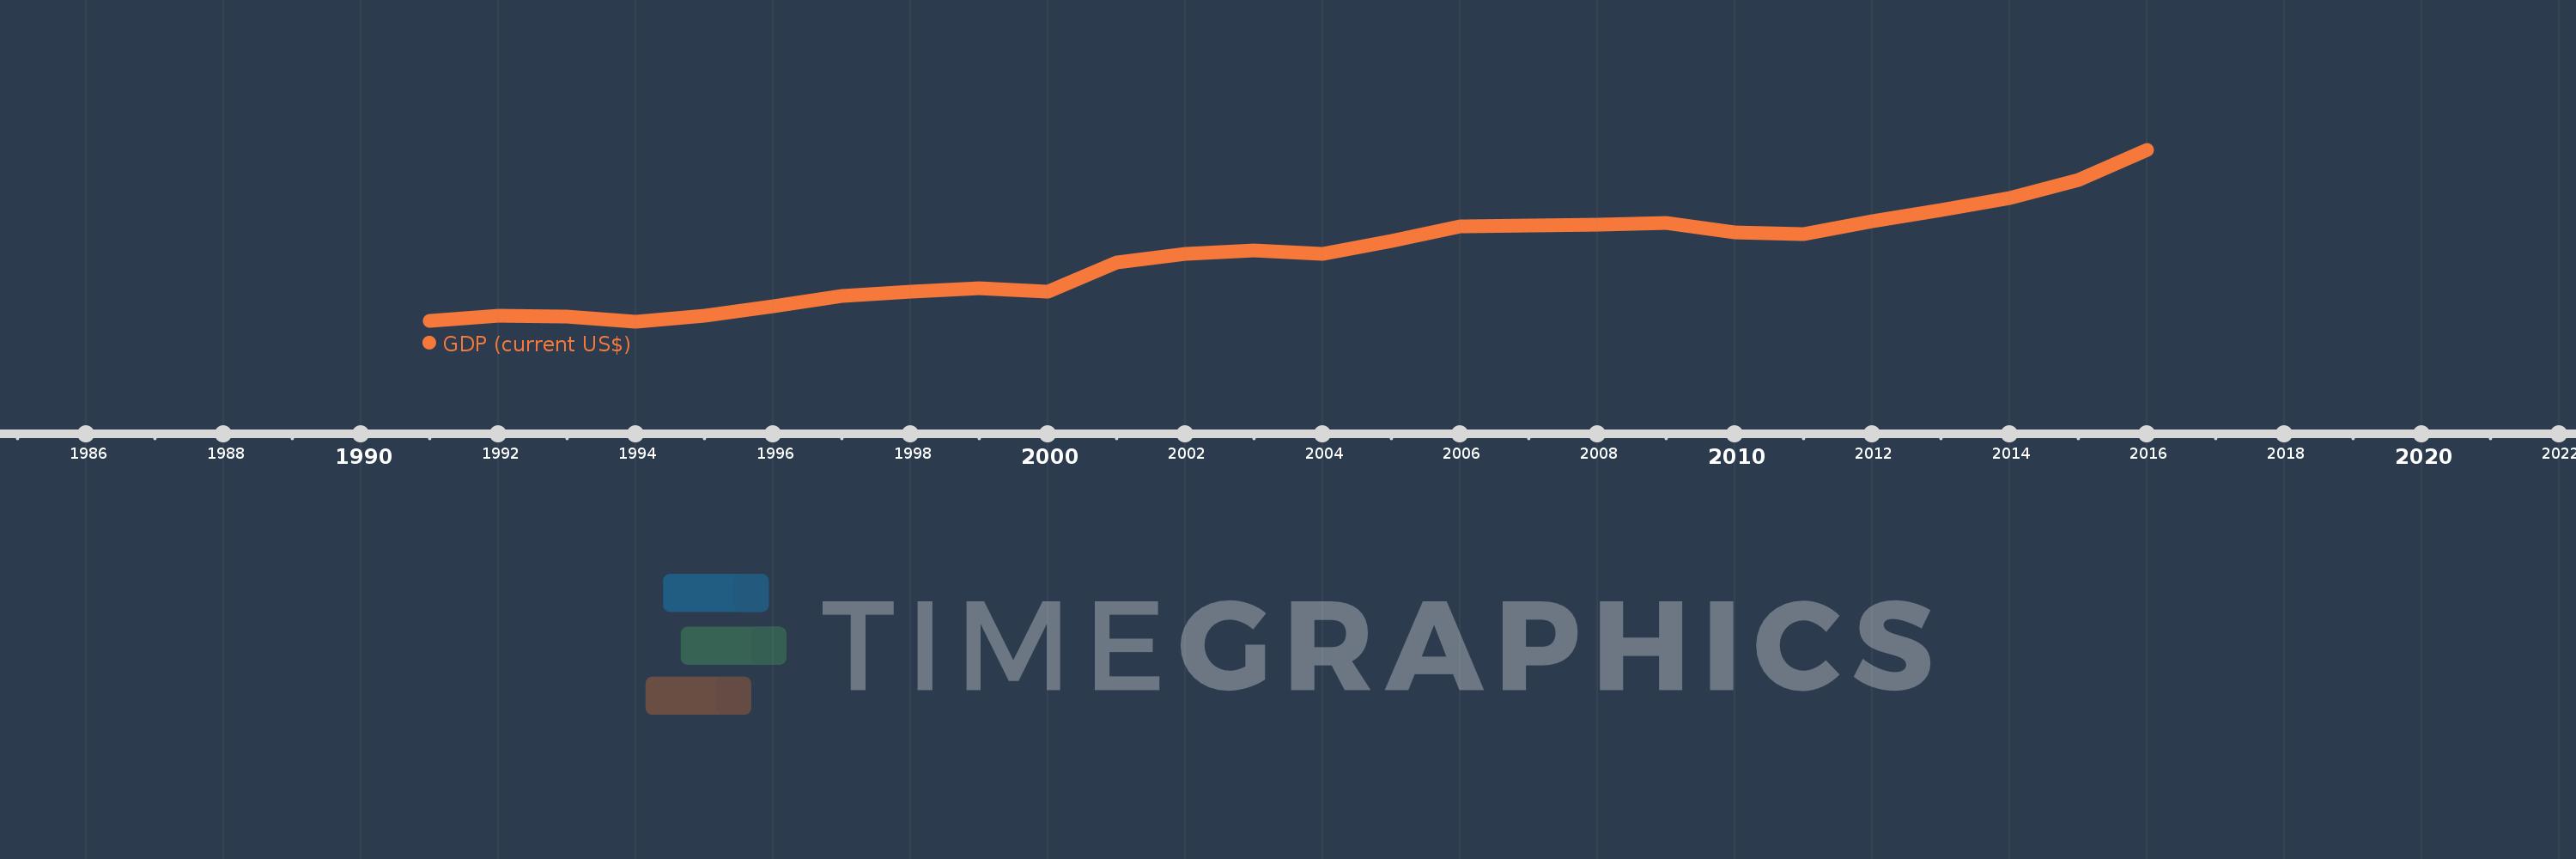
GDP (current US$)
2016,2015,2014,2013,2012,2011,2010,2009,2008,2007,2006,2005,2004,2003,2002,2001,2000,1999,1998,1997,1996,1995,1994,1993,1992,1991
This statistics in other country:
AfghanistanAlbaniaAlgeriaAndorraAngolaAntigua and BarbudaArab WorldArgentinaArmeniaArubaAustraliaAustriaAzerbaijanBahamas, TheBahrainBangladeshBarbadosBelarusBelgiumBelizeBeninBermudaBhutanBoliviaBosnia and HerzegovinaBotswanaBrazilBrunei DarussalamBulgariaBurkina FasoBurundiCabo VerdeCambodiaCameroonCanadaCaribbean small statesCayman IslandsCentral African RepublicCentral Europe and the BalticsChadChannel IslandsChileChinaColombiaComorosCongo, Dem. Rep.Congo, Rep.Costa RicaCote d'IvoireCroatiaCubaCyprusCzech RepublicDenmarkDjiboutiDominicaDominican RepublicEarly-demographic dividendEast Asia & PacificEast Asia & Pacific (excluding high income)East Asia & Pacific (IDA & IBRD countries)EcuadorEgypt, Arab Rep.El SalvadorEquatorial GuineaEritreaEstoniaEthiopiaEuro areaEurope & Central AsiaEurope & Central Asia (excluding high income)Europe & Central Asia (IDA & IBRD countries)European UnionFaroe IslandsFijiFinlandFragile and conflict affected situationsFranceFrench PolynesiaGabonGambia, TheGeorgiaGermanyGhanaGreeceGreenlandGrenadaGuatemalaGuineaGuinea-BissauGuyanaHaitiHeavily indebted poor countries (HIPC)High incomeHondurasHong Kong SAR, ChinaHungaryIBRD onlyIcelandIDA & IBRD totalIDA blendIDA onlyIDA totalIndiaIndonesiaIran, Islamic Rep.IraqIrelandIsle of ManIsraelItalyJamaicaJapanJordanKazakhstanKenyaKiribatiKorea, Rep.KosovoKuwaitKyrgyz RepublicLao PDRLate-demographic dividendLatin America & Caribbean Latin America & Caribbean (excluding high income)Latin America & the Caribbean (IDA & IBRD countries)LatviaLeast developed countries: UN classificationLebanonLesothoLiberiaLibyaLiechtensteinLithuaniaLow & middle incomeLow incomeLower middle incomeLuxembourgMacao SAR, ChinaMacedonia, FYRMadagascarMalawiMalaysiaMaldivesMaliMaltaMarshall IslandsMauritaniaMauritiusMexicoMicronesia, Fed. Sts.Middle East & North AfricaMiddle East & North Africa (excluding high income)Middle East & North Africa (IDA & IBRD countries)Middle incomeMoldovaMonacoMongoliaMontenegroMoroccoMozambiqueMyanmarNamibiaNauruNepalNetherlandsNew CaledoniaNew ZealandNicaraguaNigerNigeriaNorth AmericaNorwayOECD membersOmanOther small statesPacific island small statesPakistanPalauPanamaPapua New GuineaParaguayPeruPhilippinesPolandPortugalPost-demographic dividendPre-demographic dividendPuerto RicoQatarRomaniaRussian FederationRwandaSamoaSan MarinoSao Tome and PrincipeSaudi ArabiaSenegalSerbiaSeychellesSierra LeoneSingaporeSlovak RepublicSloveniaSmall statesSolomon IslandsSomaliaSouth AfricaSouth AsiaSouth Asia (IDA & IBRD)South SudanSpainSri LankaSt. Kitts and NevisSt. LuciaSt. Vincent and the GrenadinesSub-Saharan Africa Sub-Saharan Africa (excluding high income)Sub-Saharan Africa (IDA & IBRD countries)SudanSurinameSwazilandSwedenSwitzerlandSyrian Arab RepublicTajikistanTanzaniaThailandTimor-LesteTogoTongaTrinidad and TobagoTunisiaTurkeyTurkmenistanTuvaluUgandaUkraineUnited Arab EmiratesUnited KingdomUnited StatesUpper middle incomeUruguayUzbekistanVanuatuVenezuela, RBVietnamVirgin Islands (U.S.)West Bank and GazaWorldYemen, Rep.ZambiaZimbabwe Timeline:
This timeline shows a graph from 1991 to 2016 of Palau. No data until 1990. Number of actual observations by date: 26.
Source name:
World Development Indicators
Source organization:
World Bank national accounts data, and OECD National Accounts data files.
Categories, topics:
Economy & Growth
Last updated:
apr 23, 2017
Indicators value changes by year
Minimum:
75.907 mln
jan 1, 1994
Maximum:
287.4 mln
jan 1, 2016
At the date of observation
Value
Absolute change
Change from previous value
jan 1, 1991
76.888 mln
+76.888 mln
0.0%
jan 1, 1992
83.855 mln
+6.967 mln
9.06%
jan 1, 1993
82.451 mln
-1.404 mln
-1.67%
jan 1, 1994
75.907 mln
-6.544 mln
-7.94%
jan 1, 1995
83.527 mln
+7.62 mln
10.04%
jan 1, 1996
95.237 mln
+11.71 mln
14.02%
jan 1, 1997
108.203 mln
+12.966 mln
13.61%
jan 1, 1998
113.213 mln
+5.01 mln
4.63%
jan 1, 1999
117.32 mln
+4.107 mln
3.63%
jan 1, 2000
113.485 mln
-3.835 mln
-3.27%
jan 1, 2001
149.3 mln
+35.815 mln
31.56%
jan 1, 2002
160.0 mln
+10.7 mln
7.17%
jan 1, 2003
163.5 mln
+3.5 mln
2.19%
jan 1, 2004
159.9 mln
-3.6 mln
-2.2%
jan 1, 2005
175.3 mln
+15.4 mln
9.63%
jan 1, 2006
193.3 mln
+18.0 mln
10.27%
jan 1, 2007
194.7 mln
+1.4 mln
0.72%
jan 1, 2008
196.0 mln
+1.3 mln
0.67%
jan 1, 2009
198.1 mln
+2.1 mln
1.07%
jan 1, 2010
186.4 mln
-11.7 mln
-5.91%
jan 1, 2011
183.8 mln
-2.6 mln
-1.39%
jan 1, 2012
199.9 mln
+16.1 mln
8.76%
jan 1, 2013
214.2 mln
+14.3 mln
7.15%
jan 1, 2014
228.7 mln
+14.5 mln
6.77%
jan 1, 2015
250.9 mln
+22.2 mln
9.71%
jan 1, 2016
287.4 mln
+36.5 mln
14.55%
Ranking of countries by current statistics by years


Comments: