29
/
en
AIzaSyAYiBZKx7MnpbEhh9jyipgxe19OcubqV5w
April 1, 2024
88063
Bolivia
BOL
true
2
1
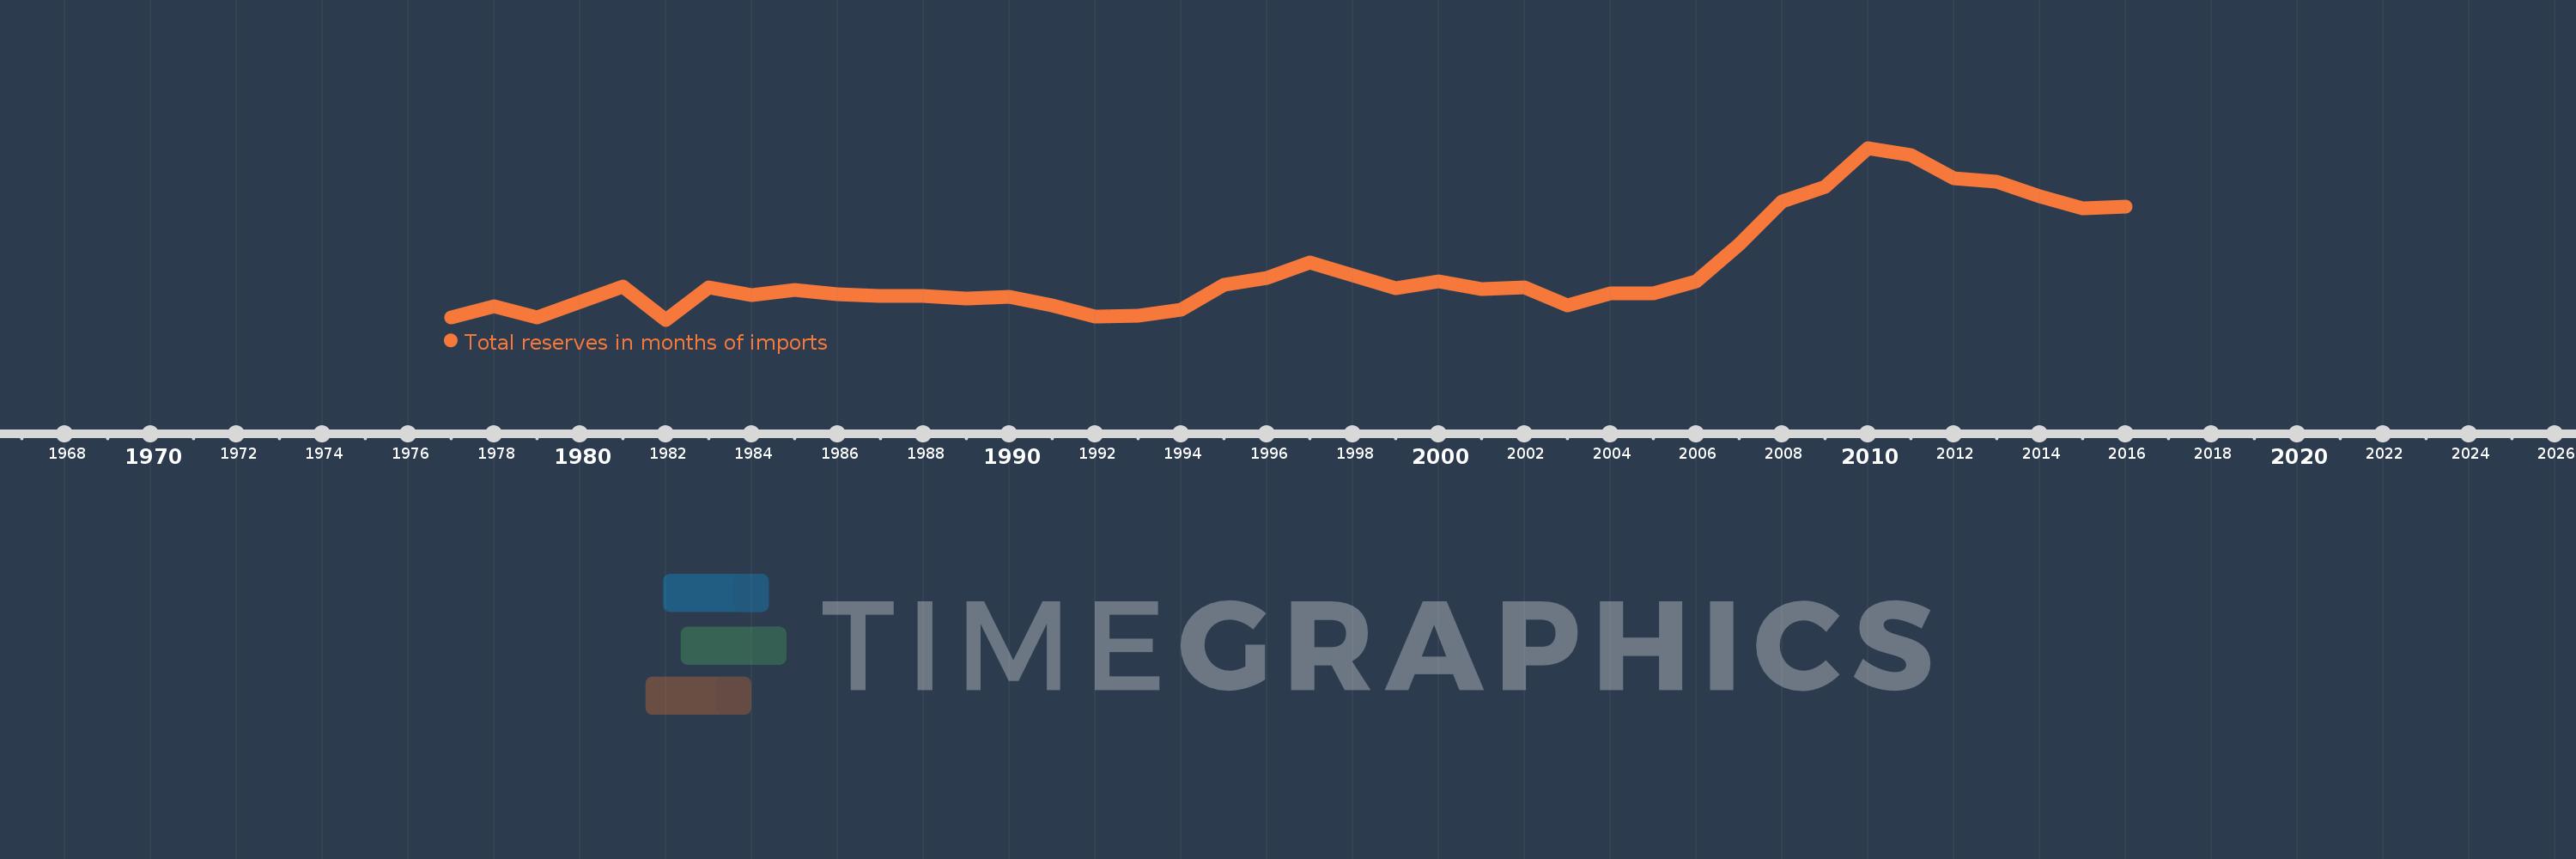
Total reserves in months of imports
2016,2015,2014,2013,2012,2011,2010,2009,2008,2007,2006,2005,2004,2003,2002,2001,2000,1999,1998,1997,1996,1995,1994,1993,1992,1991,1990,1989,1988,1987,1986,1985,1984,1983,1982,1981,1980,1979,1978,1977
This statistics in other country:
AfghanistanAlbaniaAlgeriaAngolaAntigua and BarbudaArab WorldArgentinaArmeniaArubaAustraliaAustriaAzerbaijanBahamas, TheBahrainBangladeshBarbadosBelarusBelgiumBelizeBeninBhutanBoliviaBosnia and HerzegovinaBotswanaBrazilBrunei DarussalamBulgariaBurkina FasoBurundiCabo VerdeCambodiaCameroonCanadaCaribbean small statesCentral African RepublicCentral Europe and the BalticsChadChileChinaColombiaComorosCongo, Dem. Rep.Congo, Rep.Costa RicaCote d'IvoireCroatiaCuracaoCyprusCzech RepublicDenmarkDjiboutiDominicaDominican RepublicEarly-demographic dividendEast Asia & PacificEast Asia & Pacific (excluding high income)East Asia & Pacific (IDA & IBRD countries)EcuadorEgypt, Arab Rep.El SalvadorEquatorial GuineaEritreaEstoniaEthiopiaEuro areaEurope & Central AsiaEurope & Central Asia (excluding high income)Europe & Central Asia (IDA & IBRD countries)European UnionFijiFinlandFragile and conflict affected situationsFranceGabonGambia, TheGeorgiaGermanyGhanaGreeceGrenadaGuatemalaGuineaGuinea-BissauGuyanaHaitiHeavily indebted poor countries (HIPC)High incomeHondurasHong Kong SAR, ChinaHungaryIBRD onlyIcelandIDA & IBRD totalIDA blendIDA onlyIDA totalIndiaIndonesiaIran, Islamic Rep.IraqIrelandIsraelItalyJamaicaJapanJordanKazakhstanKenyaKorea, Rep.KosovoKuwaitKyrgyz RepublicLao PDRLate-demographic dividendLatin America & Caribbean Latin America & Caribbean (excluding high income)Latin America & the Caribbean (IDA & IBRD countries)LatviaLeast developed countries: UN classificationLebanonLesothoLiberiaLibyaLithuaniaLow & middle incomeLow incomeLower middle incomeLuxembourgMacao SAR, ChinaMacedonia, FYRMadagascarMalawiMalaysiaMaldivesMaliMaltaMauritaniaMauritiusMexicoMicronesia, Fed. Sts.Middle East & North AfricaMiddle East & North Africa (excluding high income)Middle East & North Africa (IDA & IBRD countries)Middle incomeMoldovaMongoliaMontenegroMoroccoMozambiqueMyanmarNamibiaNepalNetherlandsNicaraguaNigerNigeriaNorth AmericaNorwayOECD membersOmanOther small statesPacific island small statesPakistanPanamaPapua New GuineaParaguayPeruPhilippinesPolandPortugalPost-demographic dividendPre-demographic dividendQatarRomaniaRussian FederationRwandaSamoaSao Tome and PrincipeSaudi ArabiaSenegalSerbiaSeychellesSierra LeoneSingaporeSlovak RepublicSloveniaSmall statesSolomon IslandsSouth AfricaSouth AsiaSouth Asia (IDA & IBRD)South SudanSpainSri LankaSt. Kitts and NevisSt. LuciaSt. Vincent and the GrenadinesSub-Saharan Africa Sub-Saharan Africa (excluding high income)Sub-Saharan Africa (IDA & IBRD countries)SudanSurinameSwazilandSwedenSwitzerlandSyrian Arab RepublicTajikistanTanzaniaThailandTimor-LesteTogoTongaTrinidad and TobagoTunisiaTurkeyUgandaUkraineUnited KingdomUnited StatesUpper middle incomeUruguayVanuatuVenezuela, RBVietnamWest Bank and GazaWorldYemen, Rep.ZambiaZimbabwe Timeline:
This timeline shows a graph from 1977 to 2016 of Bolivia. No data until 1976. Number of actual observations by date: 40.
Source name:
World Development Indicators
Source organization:
International Monetary Fund, International Financial Statistics and data files.
Categories, topics:
Financial Sector, External Debt
Last updated:
apr 23, 2017
Indicators value changes by year
Maximum:
16.973
jan 1, 2010
At the date of observation
Value
Absolute change
Change from previous value
jan 1, 1977
3.527
+3.527
0.0%
jan 1, 1978
4.468
+0.941
26.67%
jan 1, 1979
3.556
-0.912
-20.41%
jan 1, 1980
4.793
+1.237
34.78%
jan 1, 1981
5.974
+1.181
24.64%
jan 1, 1982
3.376
-2.598
-43.49%
jan 1, 1983
5.938
+2.563
75.91%
jan 1, 1984
5.341
-0.598
-10.07%
jan 1, 1985
5.76
+0.419
7.85%
jan 1, 1986
5.376
-0.384
-6.66%
jan 1, 1987
5.272
-0.104
-1.94%
jan 1, 1988
5.258
-0.014
-0.27%
jan 1, 1989
5.024
-0.233
-4.44%
jan 1, 1990
5.158
+0.133
2.65%
jan 1, 1991
4.53
-0.628
-12.18%
jan 1, 1992
3.654
-0.875
-19.33%
jan 1, 1993
3.672
+0.018
0.49%
jan 1, 1994
4.167
+0.495
13.48%
jan 1, 1995
6.127
+1.96
47.03%
jan 1, 1996
6.671
+0.544
8.88%
jan 1, 1997
7.936
+1.265
18.97%
jan 1, 1998
6.919
-1.017
-12.81%
jan 1, 1999
5.876
-1.043
-15.08%
jan 1, 2000
6.398
+0.522
8.88%
jan 1, 2001
5.817
-0.581
-9.08%
jan 1, 2002
5.948
+0.132
2.26%
jan 1, 2003
4.501
-1.447
-24.33%
jan 1, 2004
5.435
+0.934
20.75%
jan 1, 2005
5.465
+0.03
0.55%
jan 1, 2006
6.406
+0.941
17.22%
jan 1, 2007
9.372
+2.966
46.29%
jan 1, 2008
12.754
+3.382
36.09%
jan 1, 2009
13.908
+1.154
9.04%
jan 1, 2010
16.973
+3.066
22.04%
jan 1, 2011
16.386
-0.587
-3.46%
jan 1, 2012
14.54
-1.846
-11.27%
jan 1, 2013
14.294
-0.246
-1.69%
jan 1, 2014
13.178
-1.116
-7.81%
jan 1, 2015
12.215
-0.964
-7.31%
jan 1, 2016
12.341
+0.127
1.04%
Ranking of countries by current statistics by years


Comments: