29
/
en
AIzaSyAYiBZKx7MnpbEhh9jyipgxe19OcubqV5w
April 1, 2024
156827
Indonesia
IDN
true
2
1
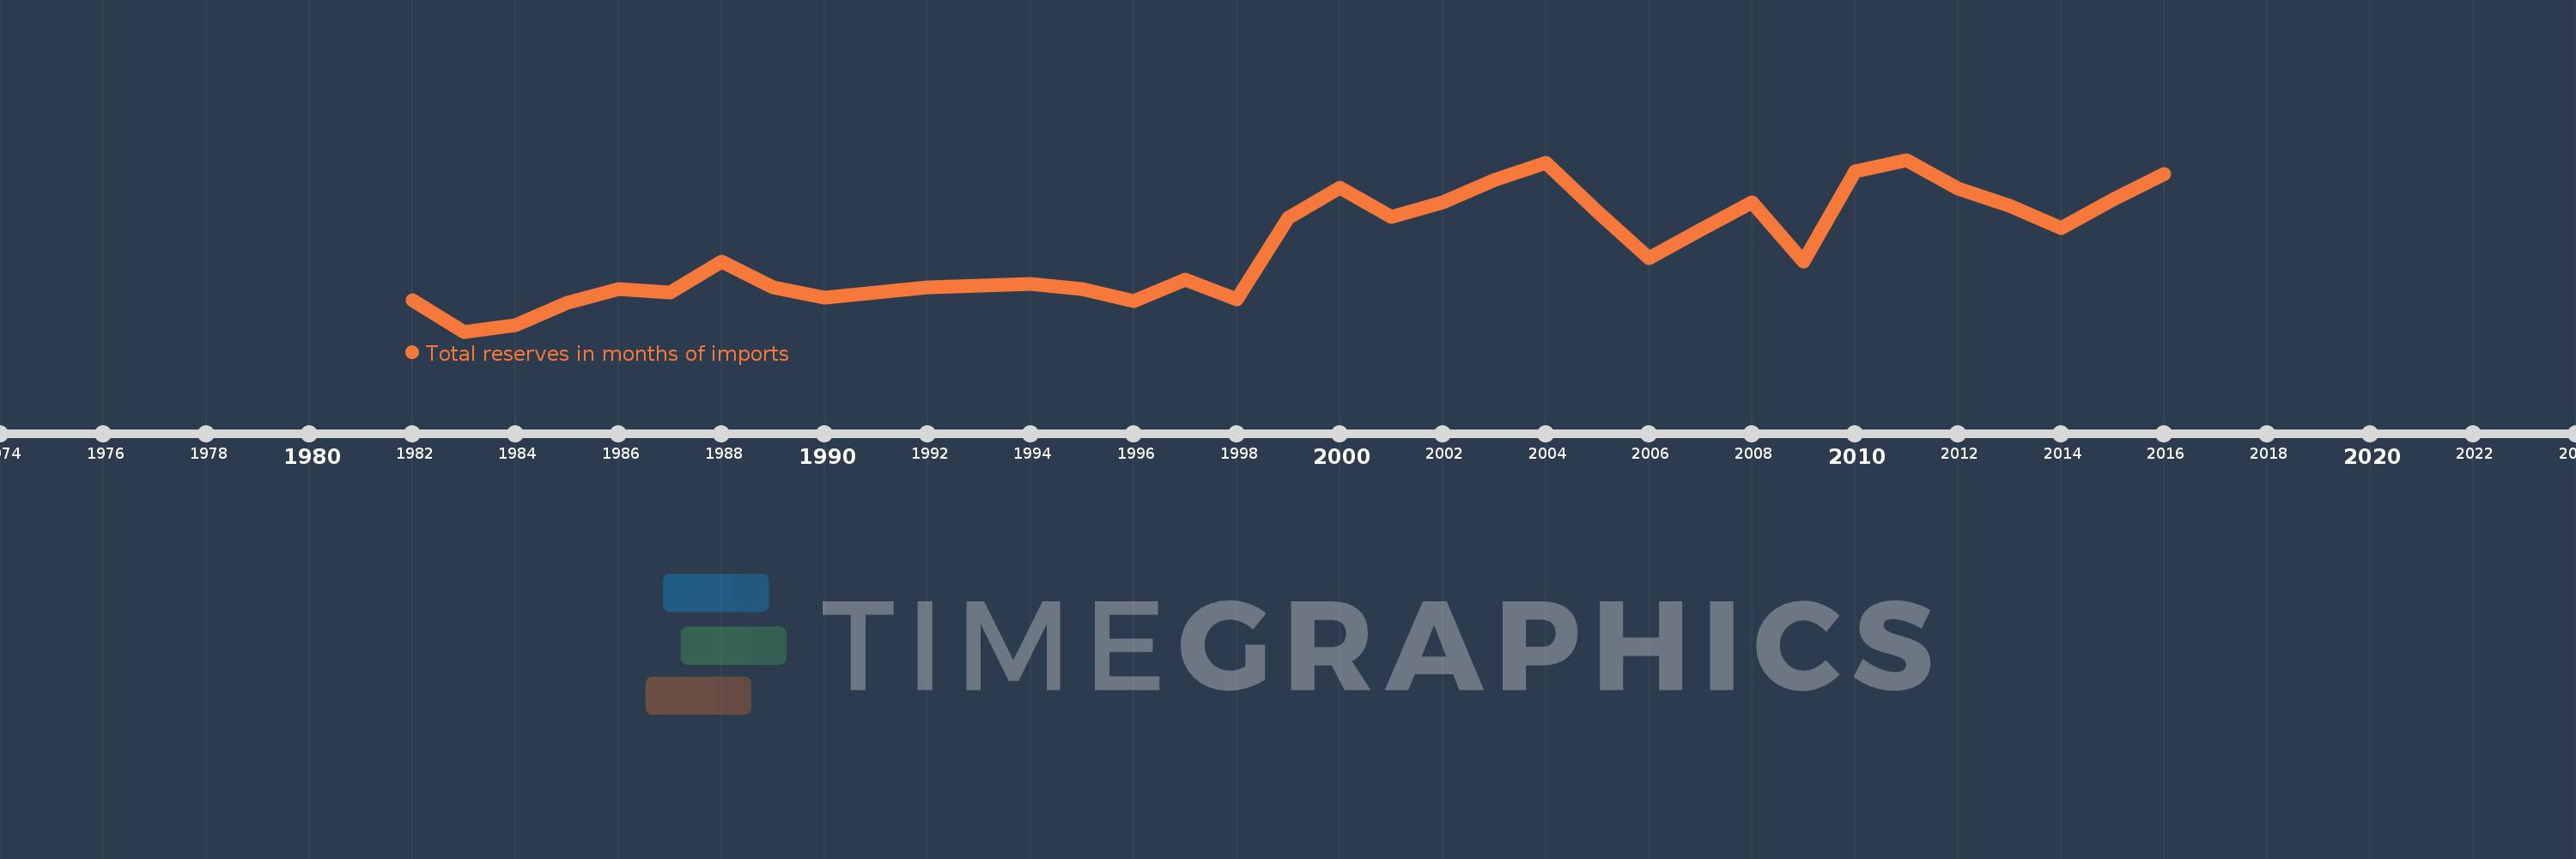
Total reserves in months of imports
2016,2015,2014,2013,2012,2011,2010,2009,2008,2007,2006,2005,2004,2003,2002,2001,2000,1999,1998,1997,1996,1995,1994,1993,1992,1991,1990,1989,1988,1987,1986,1985,1984,1983,1982
This statistics in other country:
AfghanistanAlbaniaAlgeriaAngolaAntigua and BarbudaArab WorldArgentinaArmeniaArubaAustraliaAustriaAzerbaijanBahamas, TheBahrainBangladeshBarbadosBelarusBelgiumBelizeBeninBhutanBoliviaBosnia and HerzegovinaBotswanaBrazilBrunei DarussalamBulgariaBurkina FasoBurundiCabo VerdeCambodiaCameroonCanadaCaribbean small statesCentral African RepublicCentral Europe and the BalticsChadChileChinaColombiaComorosCongo, Dem. Rep.Congo, Rep.Costa RicaCote d'IvoireCroatiaCuracaoCyprusCzech RepublicDenmarkDjiboutiDominicaDominican RepublicEarly-demographic dividendEast Asia & PacificEast Asia & Pacific (excluding high income)East Asia & Pacific (IDA & IBRD countries)EcuadorEgypt, Arab Rep.El SalvadorEquatorial GuineaEritreaEstoniaEthiopiaEuro areaEurope & Central AsiaEurope & Central Asia (excluding high income)Europe & Central Asia (IDA & IBRD countries)European UnionFijiFinlandFragile and conflict affected situationsFranceGabonGambia, TheGeorgiaGermanyGhanaGreeceGrenadaGuatemalaGuineaGuinea-BissauGuyanaHaitiHeavily indebted poor countries (HIPC)High incomeHondurasHong Kong SAR, ChinaHungaryIBRD onlyIcelandIDA & IBRD totalIDA blendIDA onlyIDA totalIndiaIndonesiaIran, Islamic Rep.IraqIrelandIsraelItalyJamaicaJapanJordanKazakhstanKenyaKorea, Rep.KosovoKuwaitKyrgyz RepublicLao PDRLate-demographic dividendLatin America & Caribbean Latin America & Caribbean (excluding high income)Latin America & the Caribbean (IDA & IBRD countries)LatviaLeast developed countries: UN classificationLebanonLesothoLiberiaLibyaLithuaniaLow & middle incomeLow incomeLower middle incomeLuxembourgMacao SAR, ChinaMacedonia, FYRMadagascarMalawiMalaysiaMaldivesMaliMaltaMauritaniaMauritiusMexicoMicronesia, Fed. Sts.Middle East & North AfricaMiddle East & North Africa (excluding high income)Middle East & North Africa (IDA & IBRD countries)Middle incomeMoldovaMongoliaMontenegroMoroccoMozambiqueMyanmarNamibiaNepalNetherlandsNicaraguaNigerNigeriaNorth AmericaNorwayOECD membersOmanOther small statesPacific island small statesPakistanPanamaPapua New GuineaParaguayPeruPhilippinesPolandPortugalPost-demographic dividendPre-demographic dividendQatarRomaniaRussian FederationRwandaSamoaSao Tome and PrincipeSaudi ArabiaSenegalSerbiaSeychellesSierra LeoneSingaporeSlovak RepublicSloveniaSmall statesSolomon IslandsSouth AfricaSouth AsiaSouth Asia (IDA & IBRD)South SudanSpainSri LankaSt. Kitts and NevisSt. LuciaSt. Vincent and the GrenadinesSub-Saharan Africa Sub-Saharan Africa (excluding high income)Sub-Saharan Africa (IDA & IBRD countries)SudanSurinameSwazilandSwedenSwitzerlandSyrian Arab RepublicTajikistanTanzaniaThailandTimor-LesteTogoTongaTrinidad and TobagoTunisiaTurkeyUgandaUkraineUnited KingdomUnited StatesUpper middle incomeUruguayVanuatuVenezuela, RBVietnamWest Bank and GazaWorldYemen, Rep.ZambiaZimbabwe Timeline:
This timeline shows a graph from 1982 to 2016 of Indonesia. No data until 1981. Number of actual observations by date: 35.
Source name:
World Development Indicators
Source organization:
International Monetary Fund, International Financial Statistics and data files.
Categories, topics:
Financial Sector, External Debt
Last updated:
apr 23, 2017
Indicators value changes by year
At the date of observation
Value
Absolute change
Change from previous value
jan 1, 1982
2.918
+2.918
0.0%
jan 1, 1983
2.048
-0.87
-29.81%
jan 1, 1984
2.235
+0.187
9.14%
jan 1, 1985
2.844
+0.609
27.24%
jan 1, 1986
3.245
+0.4
14.08%
jan 1, 1987
3.137
-0.108
-3.34%
jan 1, 1988
4.018
+0.882
28.12%
jan 1, 1989
3.295
-0.723
-18.0%
jan 1, 1990
2.993
-0.302
-9.17%
jan 1, 1991
3.137
+0.144
4.82%
jan 1, 1992
3.28
+0.142
4.54%
jan 1, 1993
3.332
+0.052
1.58%
jan 1, 1994
3.384
+0.052
1.56%
jan 1, 1995
3.231
-0.153
-4.52%
jan 1, 1996
2.902
-0.329
-10.17%
jan 1, 1997
3.495
+0.593
20.43%
jan 1, 1998
2.955
-0.54
-15.46%
jan 1, 1999
5.233
+2.278
77.11%
jan 1, 2000
6.092
+0.859
16.42%
jan 1, 2001
5.265
-0.827
-13.58%
jan 1, 2002
5.669
+0.404
7.68%
jan 1, 2003
6.295
+0.626
11.05%
jan 1, 2004
6.775
+0.48
7.62%
jan 1, 2005
5.421
-1.354
-19.99%
jan 1, 2006
4.105
-1.316
-24.27%
jan 1, 2007
4.915
+0.811
19.75%
jan 1, 2008
5.677
+0.762
15.49%
jan 1, 2009
4.001
-1.676
-29.52%
jan 1, 2010
6.547
+2.546
63.63%
jan 1, 2011
6.87
+0.323
4.93%
jan 1, 2012
6.06
-0.81
-11.79%
jan 1, 2013
5.589
-0.47
-7.76%
jan 1, 2014
4.95
-0.639
-11.43%
jan 1, 2015
5.744
+0.794
16.04%
jan 1, 2016
6.465
+0.721
12.54%
Ranking of countries by current statistics by years


Comments: