29
/
en
AIzaSyAYiBZKx7MnpbEhh9jyipgxe19OcubqV5w
April 1, 2024
277211
United States
USA
true
2
1
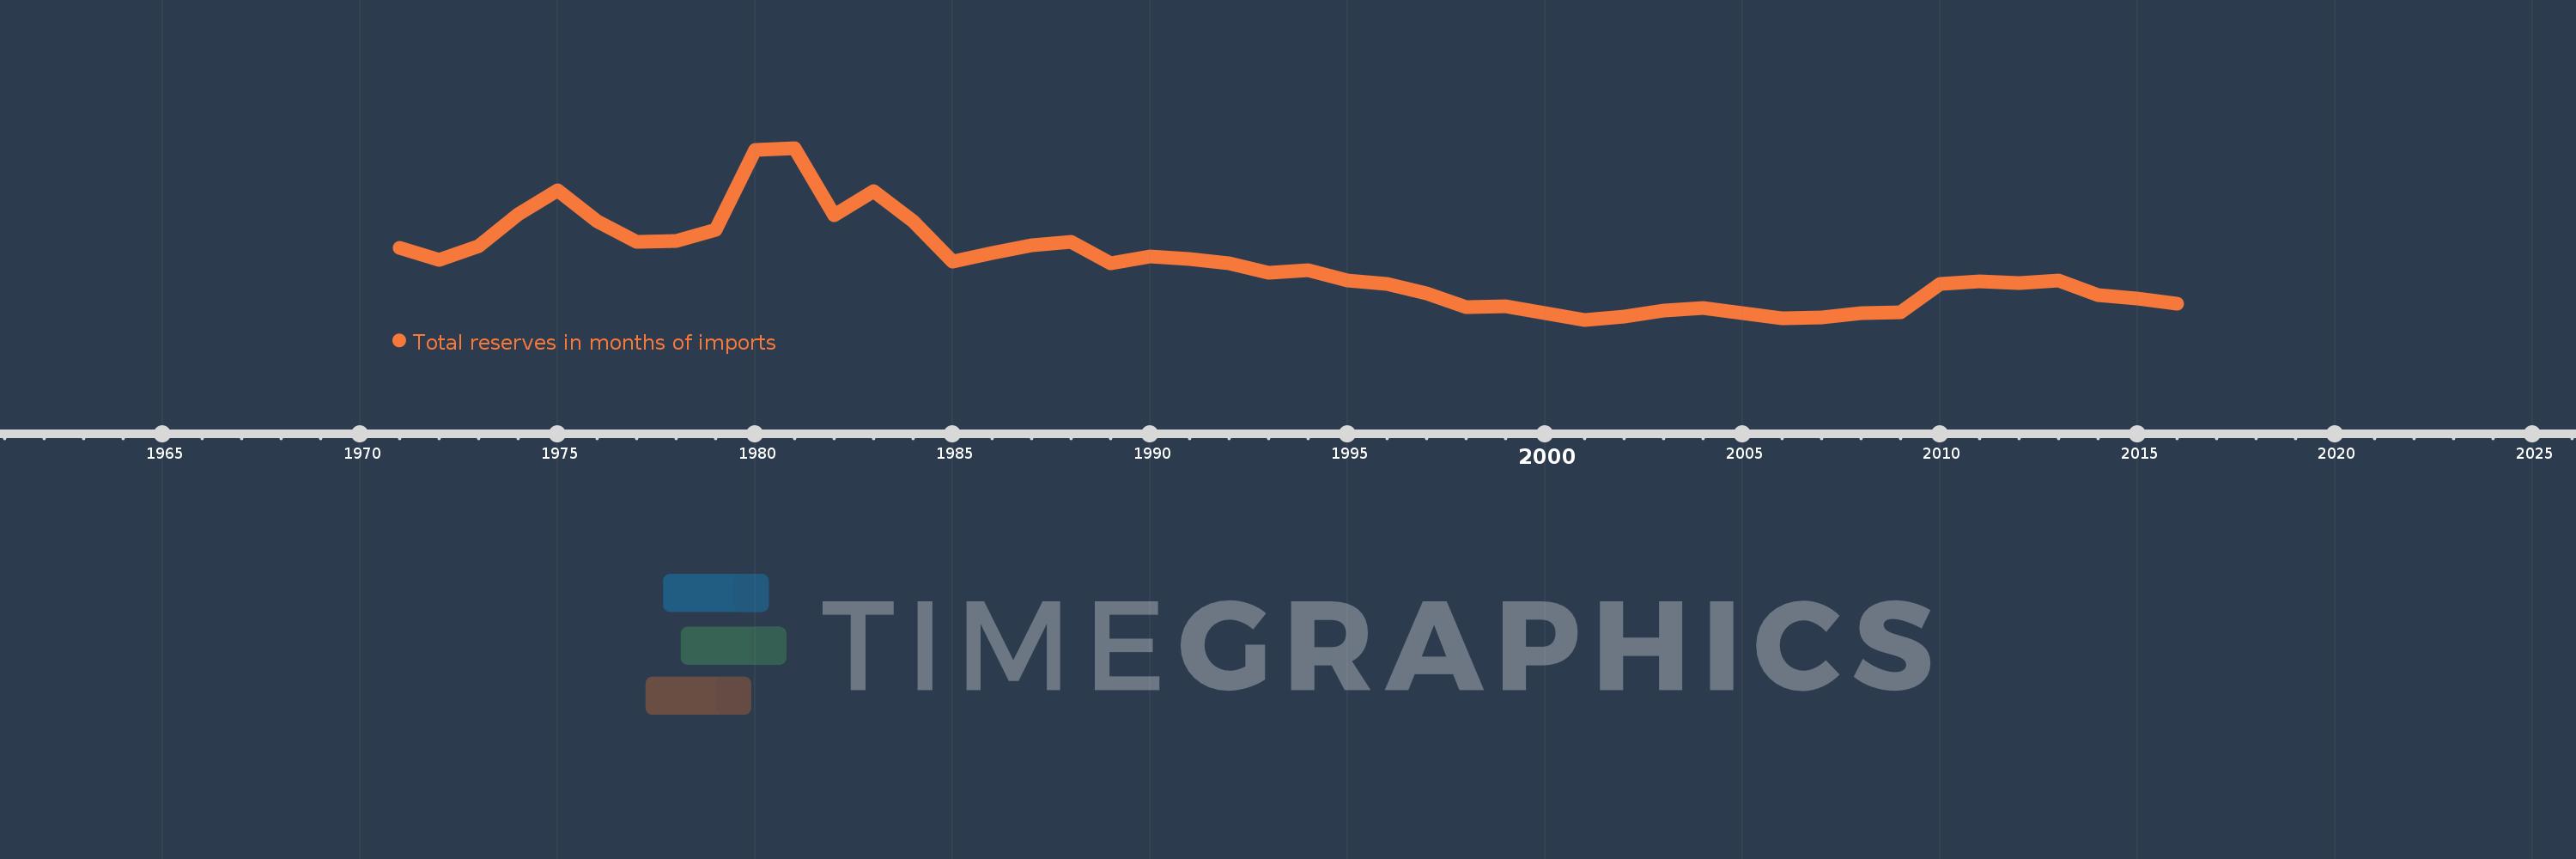
Total reserves in months of imports
2016,2015,2014,2013,2012,2011,2010,2009,2008,2007,2006,2005,2004,2003,2002,2001,2000,1999,1998,1997,1996,1995,1994,1993,1992,1991,1990,1989,1988,1987,1986,1985,1984,1983,1982,1981,1980,1979,1978,1977,1976,1975,1974,1973,1972,1971
This statistics in other country:
AfghanistanAlbaniaAlgeriaAngolaAntigua and BarbudaArab WorldArgentinaArmeniaArubaAustraliaAustriaAzerbaijanBahamas, TheBahrainBangladeshBarbadosBelarusBelgiumBelizeBeninBhutanBoliviaBosnia and HerzegovinaBotswanaBrazilBrunei DarussalamBulgariaBurkina FasoBurundiCabo VerdeCambodiaCameroonCanadaCaribbean small statesCentral African RepublicCentral Europe and the BalticsChadChileChinaColombiaComorosCongo, Dem. Rep.Congo, Rep.Costa RicaCote d'IvoireCroatiaCuracaoCyprusCzech RepublicDenmarkDjiboutiDominicaDominican RepublicEarly-demographic dividendEast Asia & PacificEast Asia & Pacific (excluding high income)East Asia & Pacific (IDA & IBRD countries)EcuadorEgypt, Arab Rep.El SalvadorEquatorial GuineaEritreaEstoniaEthiopiaEuro areaEurope & Central AsiaEurope & Central Asia (excluding high income)Europe & Central Asia (IDA & IBRD countries)European UnionFijiFinlandFragile and conflict affected situationsFranceGabonGambia, TheGeorgiaGermanyGhanaGreeceGrenadaGuatemalaGuineaGuinea-BissauGuyanaHaitiHeavily indebted poor countries (HIPC)High incomeHondurasHong Kong SAR, ChinaHungaryIBRD onlyIcelandIDA & IBRD totalIDA blendIDA onlyIDA totalIndiaIndonesiaIran, Islamic Rep.IraqIrelandIsraelItalyJamaicaJapanJordanKazakhstanKenyaKorea, Rep.KosovoKuwaitKyrgyz RepublicLao PDRLate-demographic dividendLatin America & Caribbean Latin America & Caribbean (excluding high income)Latin America & the Caribbean (IDA & IBRD countries)LatviaLeast developed countries: UN classificationLebanonLesothoLiberiaLibyaLithuaniaLow & middle incomeLow incomeLower middle incomeLuxembourgMacao SAR, ChinaMacedonia, FYRMadagascarMalawiMalaysiaMaldivesMaliMaltaMauritaniaMauritiusMexicoMicronesia, Fed. Sts.Middle East & North AfricaMiddle East & North Africa (excluding high income)Middle East & North Africa (IDA & IBRD countries)Middle incomeMoldovaMongoliaMontenegroMoroccoMozambiqueMyanmarNamibiaNepalNetherlandsNicaraguaNigerNigeriaNorth AmericaNorwayOECD membersOmanOther small statesPacific island small statesPakistanPanamaPapua New GuineaParaguayPeruPhilippinesPolandPortugalPost-demographic dividendPre-demographic dividendQatarRomaniaRussian FederationRwandaSamoaSao Tome and PrincipeSaudi ArabiaSenegalSerbiaSeychellesSierra LeoneSingaporeSlovak RepublicSloveniaSmall statesSolomon IslandsSouth AfricaSouth AsiaSouth Asia (IDA & IBRD)South SudanSpainSri LankaSt. Kitts and NevisSt. LuciaSt. Vincent and the GrenadinesSub-Saharan Africa Sub-Saharan Africa (excluding high income)Sub-Saharan Africa (IDA & IBRD countries)SudanSurinameSwazilandSwedenSwitzerlandSyrian Arab RepublicTajikistanTanzaniaThailandTimor-LesteTogoTongaTrinidad and TobagoTunisiaTurkeyUgandaUkraineUnited KingdomUnited StatesUpper middle incomeUruguayVanuatuVenezuela, RBVietnamWest Bank and GazaWorldYemen, Rep.ZambiaZimbabwe Timeline:
This timeline shows a graph from 1971 to 2016 of United States. No data until 1970. Number of actual observations by date: 46.
Source name:
World Development Indicators
Source organization:
International Monetary Fund, International Financial Statistics and data files.
Categories, topics:
Financial Sector, External Debt
Last updated:
apr 23, 2017
Indicators value changes by year
At the date of observation
Value
Absolute change
Change from previous value
jan 1, 1971
3.069
+3.069
0.0%
jan 1, 1972
2.698
-0.371
-12.08%
jan 1, 1973
3.137
+0.439
16.26%
jan 1, 1974
4.104
+0.967
30.84%
jan 1, 1975
4.858
+0.754
18.36%
jan 1, 1976
3.893
-0.965
-19.87%
jan 1, 1977
3.262
-0.631
-16.2%
jan 1, 1978
3.298
+0.036
1.1%
jan 1, 1979
3.626
+0.328
9.94%
jan 1, 1980
6.103
+2.478
68.34%
jan 1, 1981
6.162
+0.058
0.96%
jan 1, 1982
4.082
-2.079
-33.75%
jan 1, 1983
4.837
+0.755
18.5%
jan 1, 1984
3.912
-0.925
-19.12%
jan 1, 1985
2.654
-1.259
-32.17%
jan 1, 1986
2.925
+0.271
10.22%
jan 1, 1987
3.166
+0.241
8.25%
jan 1, 1988
3.265
+0.099
3.12%
jan 1, 1989
2.606
-0.659
-20.18%
jan 1, 1990
2.803
+0.197
7.56%
jan 1, 1991
2.736
-0.068
-2.41%
jan 1, 1992
2.602
-0.134
-4.89%
jan 1, 1993
2.312
-0.289
-11.12%
jan 1, 1994
2.398
+0.085
3.69%
jan 1, 1995
2.064
-0.334
-13.92%
jan 1, 1996
1.955
-0.109
-5.27%
jan 1, 1997
1.663
-0.292
-14.96%
jan 1, 1998
1.257
-0.405
-24.39%
jan 1, 1999
1.291
+0.034
2.7%
jan 1, 2000
1.079
-0.212
-16.4%
jan 1, 2001
0.862
-0.217
-20.15%
jan 1, 2002
0.954
+0.092
10.71%
jan 1, 2003
1.14
+0.186
19.51%
jan 1, 2004
1.228
+0.088
7.68%
jan 1, 2005
1.074
-0.154
-12.53%
jan 1, 2006
0.912
-0.162
-15.08%
jan 1, 2007
0.925
+0.013
1.37%
jan 1, 2008
1.074
+0.149
16.1%
jan 1, 2009
1.093
+0.02
1.82%
jan 1, 2010
1.973
+0.88
80.5%
jan 1, 2011
2.055
+0.082
4.13%
jan 1, 2012
2.006
-0.049
-2.38%
jan 1, 2013
2.083
+0.077
3.83%
jan 1, 2014
1.616
-0.467
-22.42%
jan 1, 2015
1.505
-0.111
-6.88%
jan 1, 2016
1.37
-0.135
-8.97%
Ranking of countries by current statistics by years


Comments: