29
/
en
AIzaSyAYiBZKx7MnpbEhh9jyipgxe19OcubqV5w
April 1, 2024
162061
Italy
ITA
true
2
1
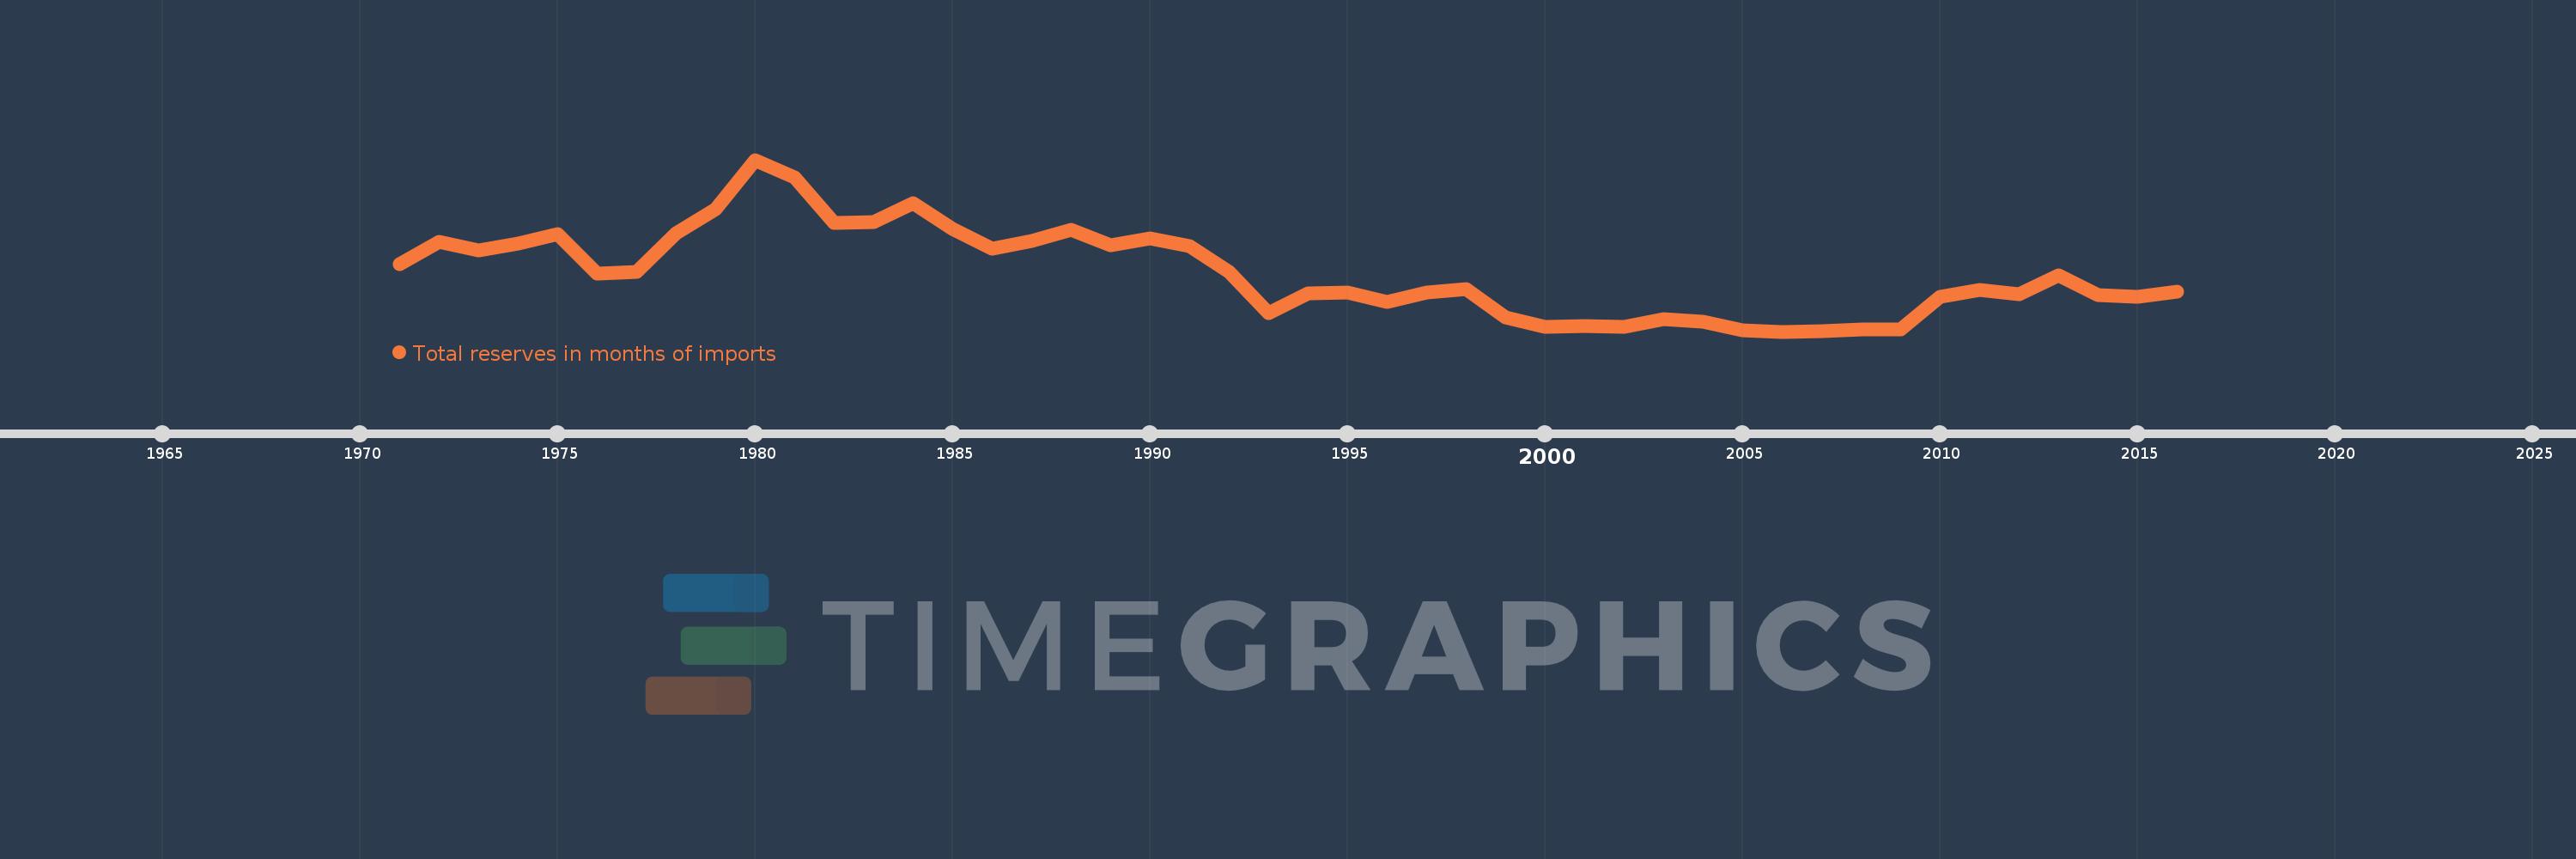
Total reserves in months of imports
2016,2015,2014,2013,2012,2011,2010,2009,2008,2007,2006,2005,2004,2003,2002,2001,2000,1999,1998,1997,1996,1995,1994,1993,1992,1991,1990,1989,1988,1987,1986,1985,1984,1983,1982,1981,1980,1979,1978,1977,1976,1975,1974,1973,1972,1971
This statistics in other country:
AfghanistanAlbaniaAlgeriaAngolaAntigua and BarbudaArab WorldArgentinaArmeniaArubaAustraliaAustriaAzerbaijanBahamas, TheBahrainBangladeshBarbadosBelarusBelgiumBelizeBeninBhutanBoliviaBosnia and HerzegovinaBotswanaBrazilBrunei DarussalamBulgariaBurkina FasoBurundiCabo VerdeCambodiaCameroonCanadaCaribbean small statesCentral African RepublicCentral Europe and the BalticsChadChileChinaColombiaComorosCongo, Dem. Rep.Congo, Rep.Costa RicaCote d'IvoireCroatiaCuracaoCyprusCzech RepublicDenmarkDjiboutiDominicaDominican RepublicEarly-demographic dividendEast Asia & PacificEast Asia & Pacific (excluding high income)East Asia & Pacific (IDA & IBRD countries)EcuadorEgypt, Arab Rep.El SalvadorEquatorial GuineaEritreaEstoniaEthiopiaEuro areaEurope & Central AsiaEurope & Central Asia (excluding high income)Europe & Central Asia (IDA & IBRD countries)European UnionFijiFinlandFragile and conflict affected situationsFranceGabonGambia, TheGeorgiaGermanyGhanaGreeceGrenadaGuatemalaGuineaGuinea-BissauGuyanaHaitiHeavily indebted poor countries (HIPC)High incomeHondurasHong Kong SAR, ChinaHungaryIBRD onlyIcelandIDA & IBRD totalIDA blendIDA onlyIDA totalIndiaIndonesiaIran, Islamic Rep.IraqIrelandIsraelItalyJamaicaJapanJordanKazakhstanKenyaKorea, Rep.KosovoKuwaitKyrgyz RepublicLao PDRLate-demographic dividendLatin America & Caribbean Latin America & Caribbean (excluding high income)Latin America & the Caribbean (IDA & IBRD countries)LatviaLeast developed countries: UN classificationLebanonLesothoLiberiaLibyaLithuaniaLow & middle incomeLow incomeLower middle incomeLuxembourgMacao SAR, ChinaMacedonia, FYRMadagascarMalawiMalaysiaMaldivesMaliMaltaMauritaniaMauritiusMexicoMicronesia, Fed. Sts.Middle East & North AfricaMiddle East & North Africa (excluding high income)Middle East & North Africa (IDA & IBRD countries)Middle incomeMoldovaMongoliaMontenegroMoroccoMozambiqueMyanmarNamibiaNepalNetherlandsNicaraguaNigerNigeriaNorth AmericaNorwayOECD membersOmanOther small statesPacific island small statesPakistanPanamaPapua New GuineaParaguayPeruPhilippinesPolandPortugalPost-demographic dividendPre-demographic dividendQatarRomaniaRussian FederationRwandaSamoaSao Tome and PrincipeSaudi ArabiaSenegalSerbiaSeychellesSierra LeoneSingaporeSlovak RepublicSloveniaSmall statesSolomon IslandsSouth AfricaSouth AsiaSouth Asia (IDA & IBRD)South SudanSpainSri LankaSt. Kitts and NevisSt. LuciaSt. Vincent and the GrenadinesSub-Saharan Africa Sub-Saharan Africa (excluding high income)Sub-Saharan Africa (IDA & IBRD countries)SudanSurinameSwazilandSwedenSwitzerlandSyrian Arab RepublicTajikistanTanzaniaThailandTimor-LesteTogoTongaTrinidad and TobagoTunisiaTurkeyUgandaUkraineUnited KingdomUnited StatesUpper middle incomeUruguayVanuatuVenezuela, RBVietnamWest Bank and GazaWorldYemen, Rep.ZambiaZimbabwe Timeline:
This timeline shows a graph from 1971 to 2016 of Italy. No data until 1970. Number of actual observations by date: 46.
Source name:
World Development Indicators
Source organization:
International Monetary Fund, International Financial Statistics and data files.
Categories, topics:
Financial Sector, External Debt
Last updated:
apr 23, 2017
Indicators value changes by year
At the date of observation
Value
Absolute change
Change from previous value
jan 1, 1971
3.695
+3.695
0.0%
jan 1, 1972
4.428
+0.733
19.84%
jan 1, 1973
4.133
-0.295
-6.66%
jan 1, 1974
4.372
+0.239
5.77%
jan 1, 1975
4.683
+0.312
7.13%
jan 1, 1976
3.386
-1.297
-27.7%
jan 1, 1977
3.437
+0.051
1.49%
jan 1, 1978
4.714
+1.277
37.15%
jan 1, 1979
5.487
+0.773
16.4%
jan 1, 1980
7.092
+1.605
29.25%
jan 1, 1981
6.515
-0.576
-8.13%
jan 1, 1982
5.032
-1.483
-22.76%
jan 1, 1983
5.056
+0.023
0.47%
jan 1, 1984
5.674
+0.618
12.22%
jan 1, 1985
4.837
-0.836
-14.74%
jan 1, 1986
4.199
-0.639
-13.2%
jan 1, 1987
4.46
+0.261
6.22%
jan 1, 1988
4.825
+0.365
8.19%
jan 1, 1989
4.32
-0.505
-10.46%
jan 1, 1990
4.543
+0.223
5.15%
jan 1, 1991
4.271
-0.272
-5.98%
jan 1, 1992
3.439
-0.832
-19.47%
jan 1, 1993
2.113
-1.326
-38.56%
jan 1, 1994
2.743
+0.629
29.78%
jan 1, 1995
2.776
+0.034
1.23%
jan 1, 1996
2.472
-0.305
-10.98%
jan 1, 1997
2.776
+0.304
12.31%
jan 1, 1998
2.899
+0.123
4.45%
jan 1, 1999
1.963
-0.936
-32.29%
jan 1, 2000
1.665
-0.299
-15.21%
jan 1, 2001
1.685
+0.02
1.23%
jan 1, 2002
1.657
-0.028
-1.67%
jan 1, 2003
1.91
+0.253
15.29%
jan 1, 2004
1.81
-0.1
-5.25%
jan 1, 2005
1.55
-0.26
-14.39%
jan 1, 2006
1.502
-0.048
-3.09%
jan 1, 2007
1.503
+0.001
0.05%
jan 1, 2008
1.58
+0.077
5.14%
jan 1, 2009
1.582
+0.002
0.13%
jan 1, 2010
2.626
+1.045
66.04%
jan 1, 2011
2.867
+0.241
9.17%
jan 1, 2012
2.718
-0.15
-5.22%
jan 1, 2013
3.345
+0.627
23.09%
jan 1, 2014
2.701
-0.644
-19.25%
jan 1, 2015
2.625
-0.076
-2.82%
jan 1, 2016
2.796
+0.172
6.55%
Ranking of countries by current statistics by years


Comments: