29
/
en
AIzaSyAYiBZKx7MnpbEhh9jyipgxe19OcubqV5w
April 1, 2024
270165
Turkey
TUR
true
2
1
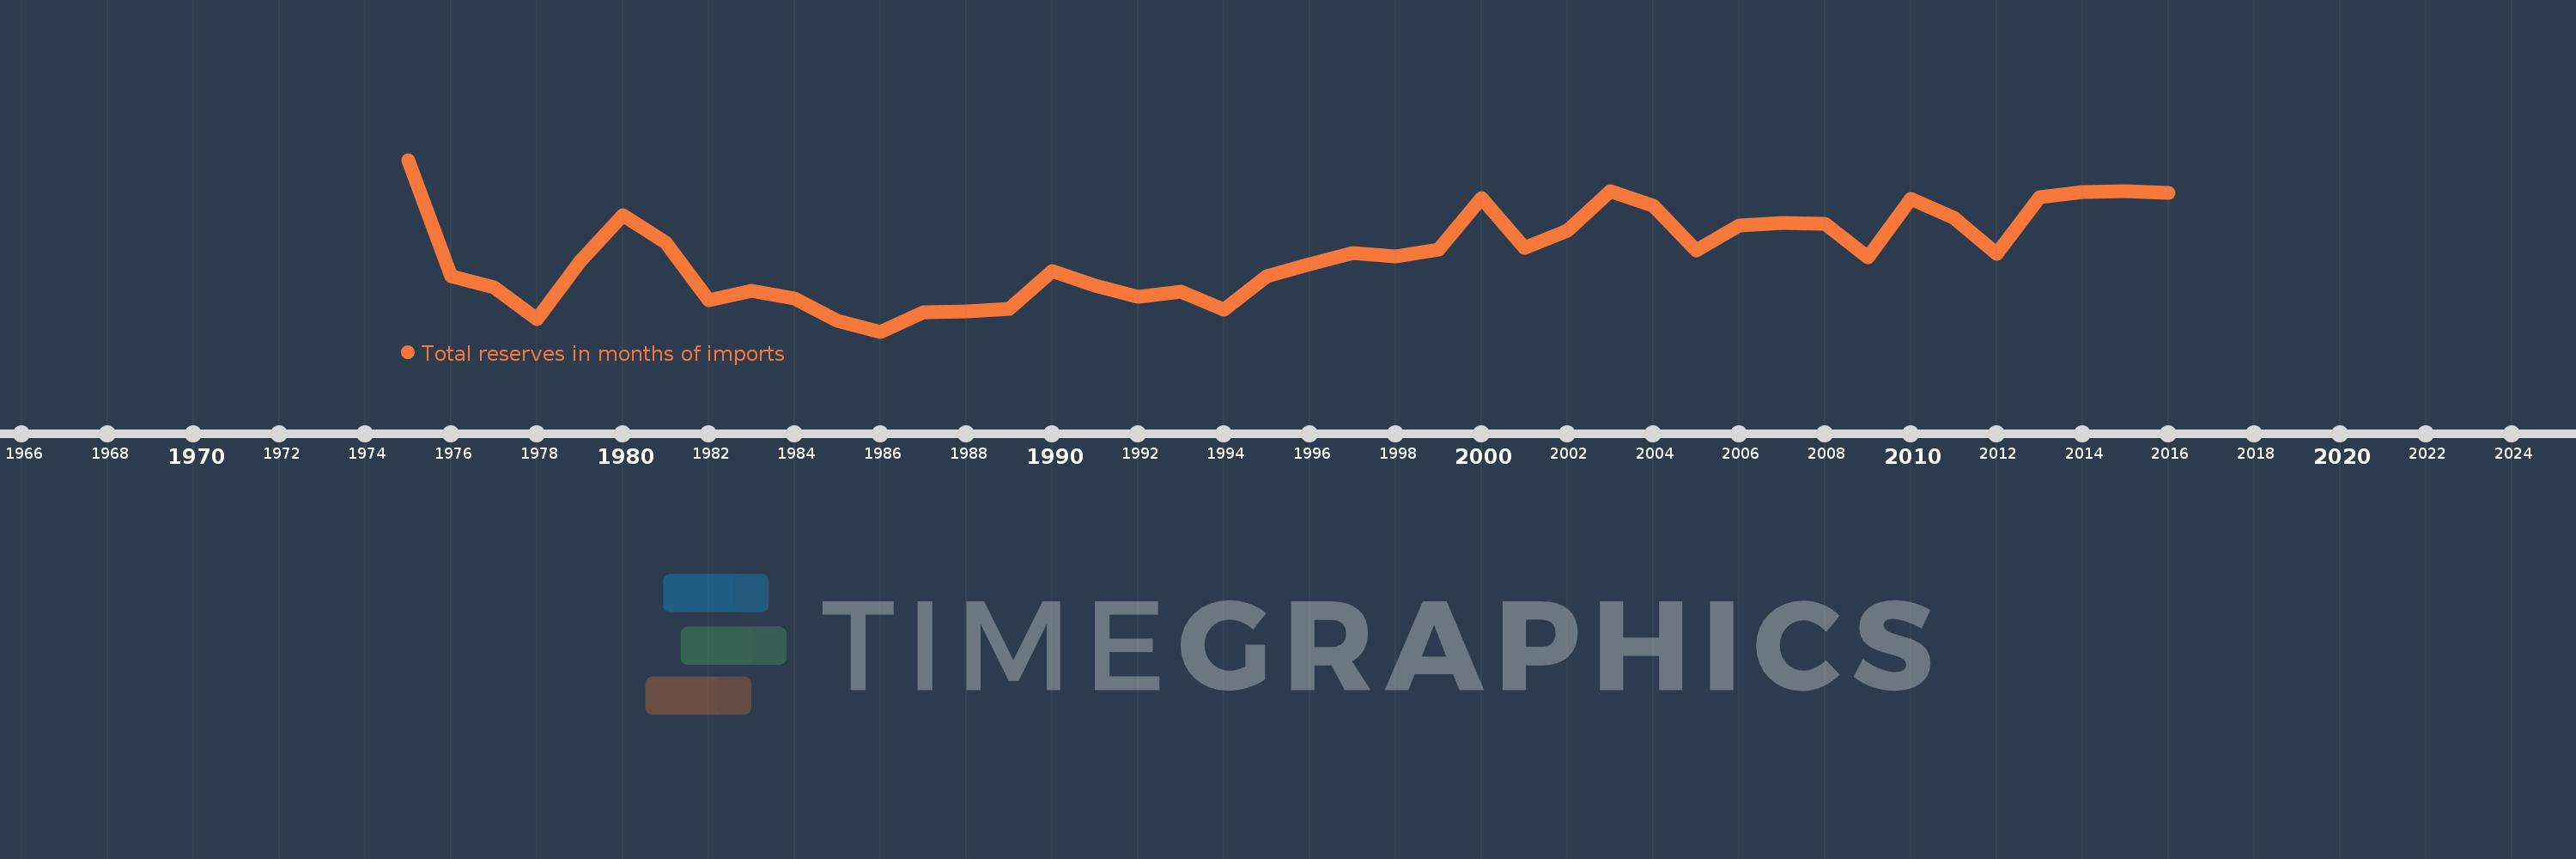
Total reserves in months of imports
2016,2015,2014,2013,2012,2011,2010,2009,2008,2007,2006,2005,2004,2003,2002,2001,2000,1999,1998,1997,1996,1995,1994,1993,1992,1991,1990,1989,1988,1987,1986,1985,1984,1983,1982,1981,1980,1979,1978,1977,1976,1975
This statistics in other country:
AfghanistanAlbaniaAlgeriaAngolaAntigua and BarbudaArab WorldArgentinaArmeniaArubaAustraliaAustriaAzerbaijanBahamas, TheBahrainBangladeshBarbadosBelarusBelgiumBelizeBeninBhutanBoliviaBosnia and HerzegovinaBotswanaBrazilBrunei DarussalamBulgariaBurkina FasoBurundiCabo VerdeCambodiaCameroonCanadaCaribbean small statesCentral African RepublicCentral Europe and the BalticsChadChileChinaColombiaComorosCongo, Dem. Rep.Congo, Rep.Costa RicaCote d'IvoireCroatiaCuracaoCyprusCzech RepublicDenmarkDjiboutiDominicaDominican RepublicEarly-demographic dividendEast Asia & PacificEast Asia & Pacific (excluding high income)East Asia & Pacific (IDA & IBRD countries)EcuadorEgypt, Arab Rep.El SalvadorEquatorial GuineaEritreaEstoniaEthiopiaEuro areaEurope & Central AsiaEurope & Central Asia (excluding high income)Europe & Central Asia (IDA & IBRD countries)European UnionFijiFinlandFragile and conflict affected situationsFranceGabonGambia, TheGeorgiaGermanyGhanaGreeceGrenadaGuatemalaGuineaGuinea-BissauGuyanaHaitiHeavily indebted poor countries (HIPC)High incomeHondurasHong Kong SAR, ChinaHungaryIBRD onlyIcelandIDA & IBRD totalIDA blendIDA onlyIDA totalIndiaIndonesiaIran, Islamic Rep.IraqIrelandIsraelItalyJamaicaJapanJordanKazakhstanKenyaKorea, Rep.KosovoKuwaitKyrgyz RepublicLao PDRLate-demographic dividendLatin America & Caribbean Latin America & Caribbean (excluding high income)Latin America & the Caribbean (IDA & IBRD countries)LatviaLeast developed countries: UN classificationLebanonLesothoLiberiaLibyaLithuaniaLow & middle incomeLow incomeLower middle incomeLuxembourgMacao SAR, ChinaMacedonia, FYRMadagascarMalawiMalaysiaMaldivesMaliMaltaMauritaniaMauritiusMexicoMicronesia, Fed. Sts.Middle East & North AfricaMiddle East & North Africa (excluding high income)Middle East & North Africa (IDA & IBRD countries)Middle incomeMoldovaMongoliaMontenegroMoroccoMozambiqueMyanmarNamibiaNepalNetherlandsNicaraguaNigerNigeriaNorth AmericaNorwayOECD membersOmanOther small statesPacific island small statesPakistanPanamaPapua New GuineaParaguayPeruPhilippinesPolandPortugalPost-demographic dividendPre-demographic dividendQatarRomaniaRussian FederationRwandaSamoaSao Tome and PrincipeSaudi ArabiaSenegalSerbiaSeychellesSierra LeoneSingaporeSlovak RepublicSloveniaSmall statesSolomon IslandsSouth AfricaSouth AsiaSouth Asia (IDA & IBRD)South SudanSpainSri LankaSt. Kitts and NevisSt. LuciaSt. Vincent and the GrenadinesSub-Saharan Africa Sub-Saharan Africa (excluding high income)Sub-Saharan Africa (IDA & IBRD countries)SudanSurinameSwazilandSwedenSwitzerlandSyrian Arab RepublicTajikistanTanzaniaThailandTimor-LesteTogoTongaTrinidad and TobagoTunisiaTurkeyUgandaUkraineUnited KingdomUnited StatesUpper middle incomeUruguayVanuatuVenezuela, RBVietnamWest Bank and GazaWorldYemen, Rep.ZambiaZimbabwe Timeline:
This timeline shows a graph from 1975 to 2016 of Turkey. No data until 1974. Number of actual observations by date: 42.
Source name:
World Development Indicators
Source organization:
International Monetary Fund, International Financial Statistics and data files.
Categories, topics:
Financial Sector, External Debt
Last updated:
apr 23, 2017
Indicators value changes by year
At the date of observation
Value
Absolute change
Change from previous value
jan 1, 1975
6.467
+6.467
0.0%
jan 1, 1976
3.397
-3.07
-47.48%
jan 1, 1977
3.103
-0.293
-8.64%
jan 1, 1978
2.271
-0.833
-26.83%
jan 1, 1979
3.773
+1.502
66.15%
jan 1, 1980
5.012
+1.239
32.84%
jan 1, 1981
4.278
-0.734
-14.64%
jan 1, 1982
2.769
-1.509
-35.27%
jan 1, 1983
3.014
+0.245
8.85%
jan 1, 1984
2.815
-0.199
-6.59%
jan 1, 1985
2.223
-0.592
-21.04%
jan 1, 1986
1.939
-0.285
-12.8%
jan 1, 1987
2.457
+0.518
26.73%
jan 1, 1988
2.469
+0.012
0.5%
jan 1, 1989
2.545
+0.076
3.08%
jan 1, 1990
3.537
+0.992
38.99%
jan 1, 1991
3.161
-0.376
-10.63%
jan 1, 1992
2.86
-0.301
-9.54%
jan 1, 1993
2.983
+0.123
4.31%
jan 1, 1994
2.512
-0.471
-15.79%
jan 1, 1995
3.401
+0.889
35.4%
jan 1, 1996
3.72
+0.319
9.38%
jan 1, 1997
4.015
+0.295
7.92%
jan 1, 1998
3.912
-0.103
-2.57%
jan 1, 1999
4.106
+0.195
4.98%
jan 1, 2000
5.466
+1.36
33.11%
jan 1, 2001
4.157
-1.309
-23.94%
jan 1, 2002
4.6
+0.443
10.65%
jan 1, 2003
5.642
+1.042
22.65%
jan 1, 2004
5.246
-0.396
-7.02%
jan 1, 2005
4.074
-1.172
-22.34%
jan 1, 2006
4.74
+0.666
16.36%
jan 1, 2007
4.806
+0.066
1.4%
jan 1, 2008
4.789
-0.017
-0.36%
jan 1, 2009
3.89
-0.9
-18.78%
jan 1, 2010
5.447
+1.558
40.05%
jan 1, 2011
4.942
-0.506
-9.28%
jan 1, 2012
3.991
-0.951
-19.24%
jan 1, 2013
5.487
+1.496
37.48%
jan 1, 2014
5.615
+0.128
2.33%
jan 1, 2015
5.65
+0.036
0.63%
jan 1, 2016
5.602
-0.048
-0.86%
Ranking of countries by current statistics by years


Comments: