29
/
en
AIzaSyAYiBZKx7MnpbEhh9jyipgxe19OcubqV5w
April 1, 2024
38648
IDA blend
IDB
false
2
1
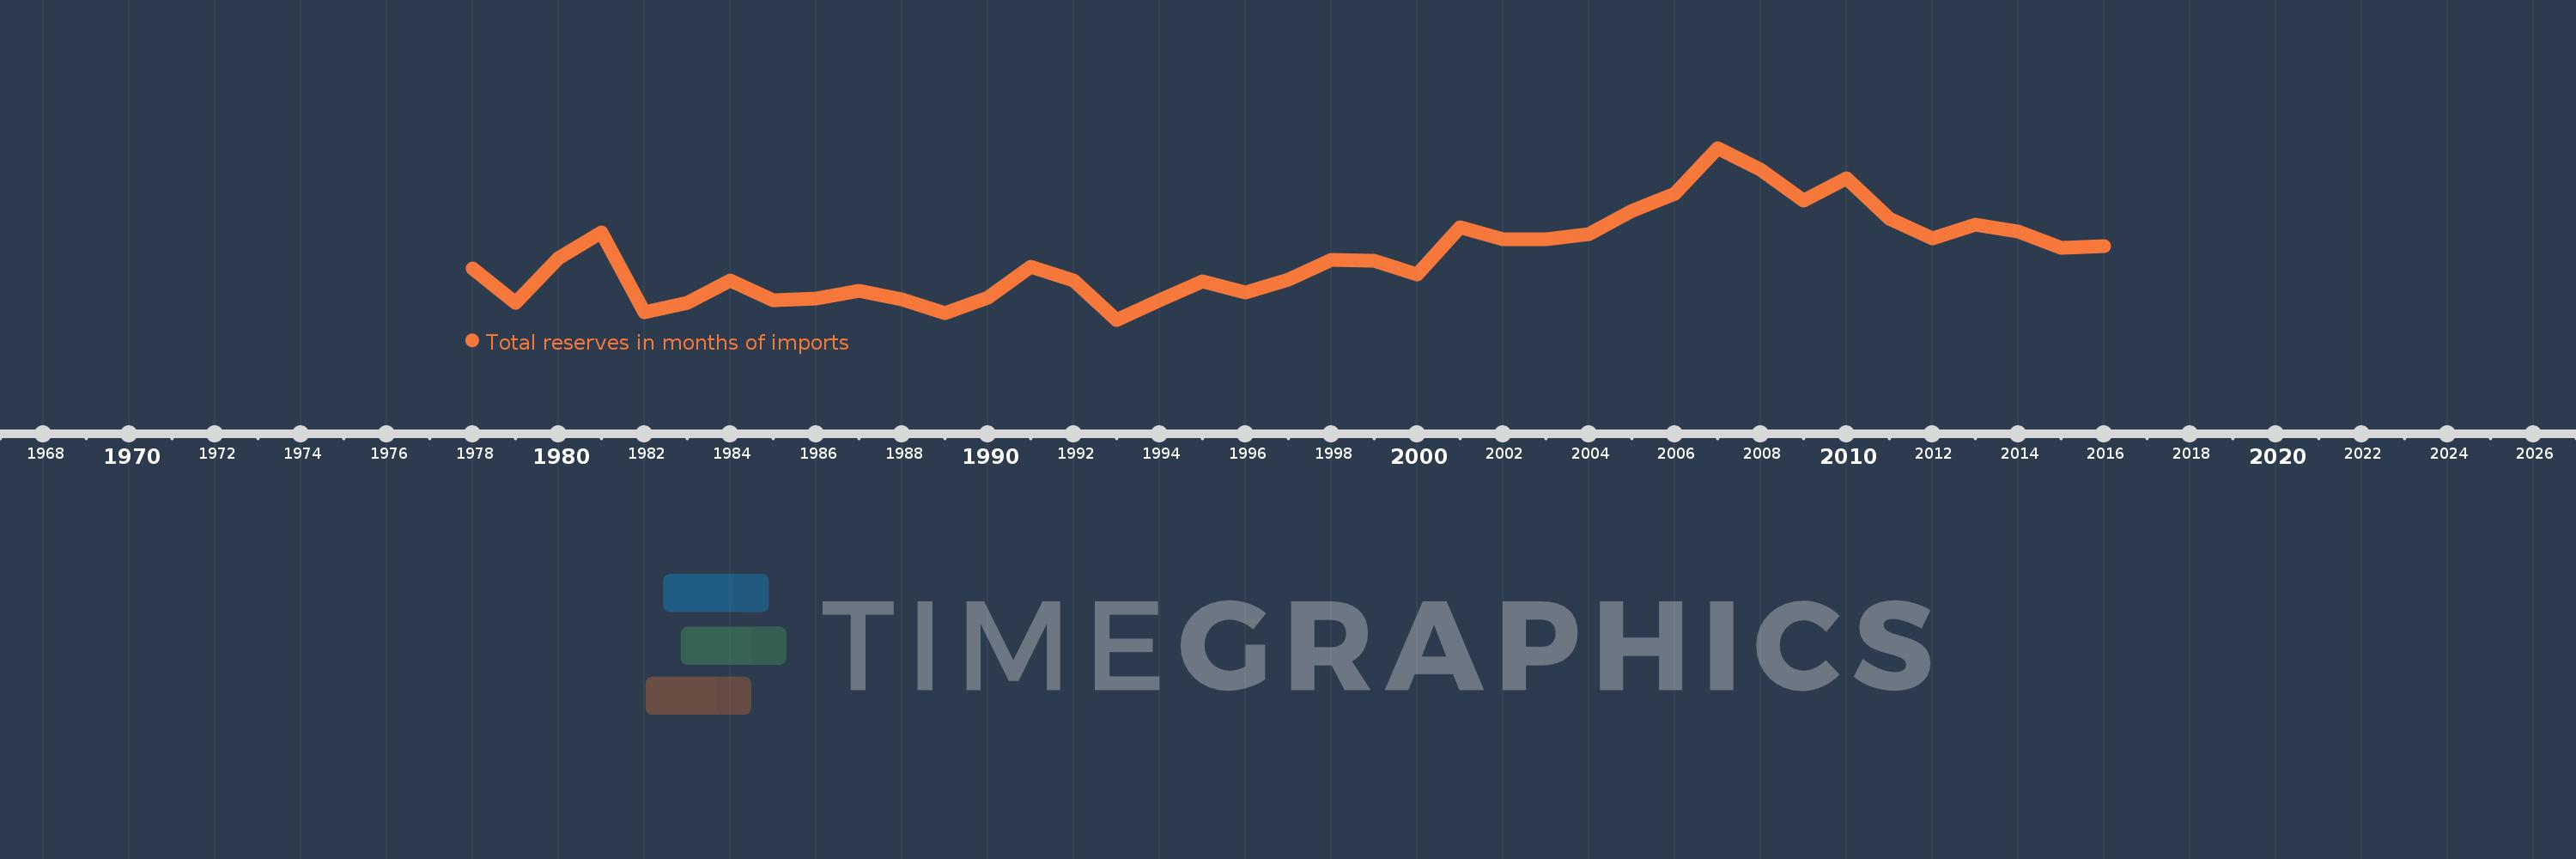
Total reserves in months of imports
2016,2015,2014,2013,2012,2011,2010,2009,2008,2007,2006,2005,2004,2003,2002,2001,2000,1999,1998,1997,1996,1995,1994,1993,1992,1991,1990,1989,1988,1987,1986,1985,1984,1983,1982,1981,1980,1979,1978
This statistics in other country:
AfghanistanAlbaniaAlgeriaAngolaAntigua and BarbudaArab WorldArgentinaArmeniaArubaAustraliaAustriaAzerbaijanBahamas, TheBahrainBangladeshBarbadosBelarusBelgiumBelizeBeninBhutanBoliviaBosnia and HerzegovinaBotswanaBrazilBrunei DarussalamBulgariaBurkina FasoBurundiCabo VerdeCambodiaCameroonCanadaCaribbean small statesCentral African RepublicCentral Europe and the BalticsChadChileChinaColombiaComorosCongo, Dem. Rep.Congo, Rep.Costa RicaCote d'IvoireCroatiaCuracaoCyprusCzech RepublicDenmarkDjiboutiDominicaDominican RepublicEarly-demographic dividendEast Asia & PacificEast Asia & Pacific (excluding high income)East Asia & Pacific (IDA & IBRD countries)EcuadorEgypt, Arab Rep.El SalvadorEquatorial GuineaEritreaEstoniaEthiopiaEuro areaEurope & Central AsiaEurope & Central Asia (excluding high income)Europe & Central Asia (IDA & IBRD countries)European UnionFijiFinlandFragile and conflict affected situationsFranceGabonGambia, TheGeorgiaGermanyGhanaGreeceGrenadaGuatemalaGuineaGuinea-BissauGuyanaHaitiHeavily indebted poor countries (HIPC)High incomeHondurasHong Kong SAR, ChinaHungaryIBRD onlyIcelandIDA & IBRD totalIDA blendIDA onlyIDA totalIndiaIndonesiaIran, Islamic Rep.IraqIrelandIsraelItalyJamaicaJapanJordanKazakhstanKenyaKorea, Rep.KosovoKuwaitKyrgyz RepublicLao PDRLate-demographic dividendLatin America & Caribbean Latin America & Caribbean (excluding high income)Latin America & the Caribbean (IDA & IBRD countries)LatviaLeast developed countries: UN classificationLebanonLesothoLiberiaLibyaLithuaniaLow & middle incomeLow incomeLower middle incomeLuxembourgMacao SAR, ChinaMacedonia, FYRMadagascarMalawiMalaysiaMaldivesMaliMaltaMauritaniaMauritiusMexicoMicronesia, Fed. Sts.Middle East & North AfricaMiddle East & North Africa (excluding high income)Middle East & North Africa (IDA & IBRD countries)Middle incomeMoldovaMongoliaMontenegroMoroccoMozambiqueMyanmarNamibiaNepalNetherlandsNicaraguaNigerNigeriaNorth AmericaNorwayOECD membersOmanOther small statesPacific island small statesPakistanPanamaPapua New GuineaParaguayPeruPhilippinesPolandPortugalPost-demographic dividendPre-demographic dividendQatarRomaniaRussian FederationRwandaSamoaSao Tome and PrincipeSaudi ArabiaSenegalSerbiaSeychellesSierra LeoneSingaporeSlovak RepublicSloveniaSmall statesSolomon IslandsSouth AfricaSouth AsiaSouth Asia (IDA & IBRD)South SudanSpainSri LankaSt. Kitts and NevisSt. LuciaSt. Vincent and the GrenadinesSub-Saharan Africa Sub-Saharan Africa (excluding high income)Sub-Saharan Africa (IDA & IBRD countries)SudanSurinameSwazilandSwedenSwitzerlandSyrian Arab RepublicTajikistanTanzaniaThailandTimor-LesteTogoTongaTrinidad and TobagoTunisiaTurkeyUgandaUkraineUnited KingdomUnited StatesUpper middle incomeUruguayVanuatuVenezuela, RBVietnamWest Bank and GazaWorldYemen, Rep.ZambiaZimbabwe Timeline:
This timeline shows a graph from 1978 to 2016 of IDA blend. No data until 1977. Number of actual observations by date: 39.
Source name:
World Development Indicators
Source organization:
International Monetary Fund, International Financial Statistics and data files.
Categories, topics:
Financial Sector, External Debt
Last updated:
apr 23, 2017
Indicators value changes by year
At the date of observation
Value
Absolute change
Change from previous value
jan 1, 1978
3.803
+3.803
0.0%
jan 1, 1979
2.542
-1.261
-33.16%
jan 1, 1980
4.171
+1.629
64.07%
jan 1, 1981
5.118
+0.948
22.72%
jan 1, 1982
2.184
-2.935
-57.34%
jan 1, 1983
2.538
+0.354
16.21%
jan 1, 1984
3.334
+0.796
31.37%
jan 1, 1985
2.631
-0.703
-21.08%
jan 1, 1986
2.676
+0.045
1.71%
jan 1, 1987
2.975
+0.299
11.18%
jan 1, 1988
2.663
-0.312
-10.49%
jan 1, 1989
2.138
-0.525
-19.7%
jan 1, 1990
2.704
+0.565
26.43%
jan 1, 1991
3.858
+1.154
42.7%
jan 1, 1992
3.355
-0.503
-13.03%
jan 1, 1993
1.908
-1.448
-43.15%
jan 1, 1994
2.635
+0.728
38.15%
jan 1, 1995
3.307
+0.671
25.47%
jan 1, 1996
2.901
-0.405
-12.26%
jan 1, 1997
3.374
+0.473
16.31%
jan 1, 1998
4.11
+0.736
21.8%
jan 1, 1999
4.082
-0.028
-0.68%
jan 1, 2000
3.585
-0.497
-12.17%
jan 1, 2001
5.294
+1.708
47.64%
jan 1, 2002
4.85
-0.443
-8.37%
jan 1, 2003
4.852
+0.002
0.04%
jan 1, 2004
5.058
+0.205
4.23%
jan 1, 2005
5.91
+0.853
16.86%
jan 1, 2006
6.542
+0.631
10.68%
jan 1, 2007
8.217
+1.676
25.61%
jan 1, 2008
7.422
-0.795
-9.67%
jan 1, 2009
6.287
-1.135
-15.29%
jan 1, 2010
7.106
+0.819
13.03%
jan 1, 2011
5.631
-1.475
-20.76%
jan 1, 2012
4.907
-0.724
-12.85%
jan 1, 2013
5.402
+0.494
10.07%
jan 1, 2014
5.136
-0.266
-4.92%
jan 1, 2015
4.564
-0.571
-11.13%
jan 1, 2016
4.617
+0.053
1.16%
Ranking of countries by current statistics by years


Comments: