29
/
en
AIzaSyAYiBZKx7MnpbEhh9jyipgxe19OcubqV5w
April 1, 2024
28785
East Asia & Pacific (excluding high income)
EAP
false
2
1
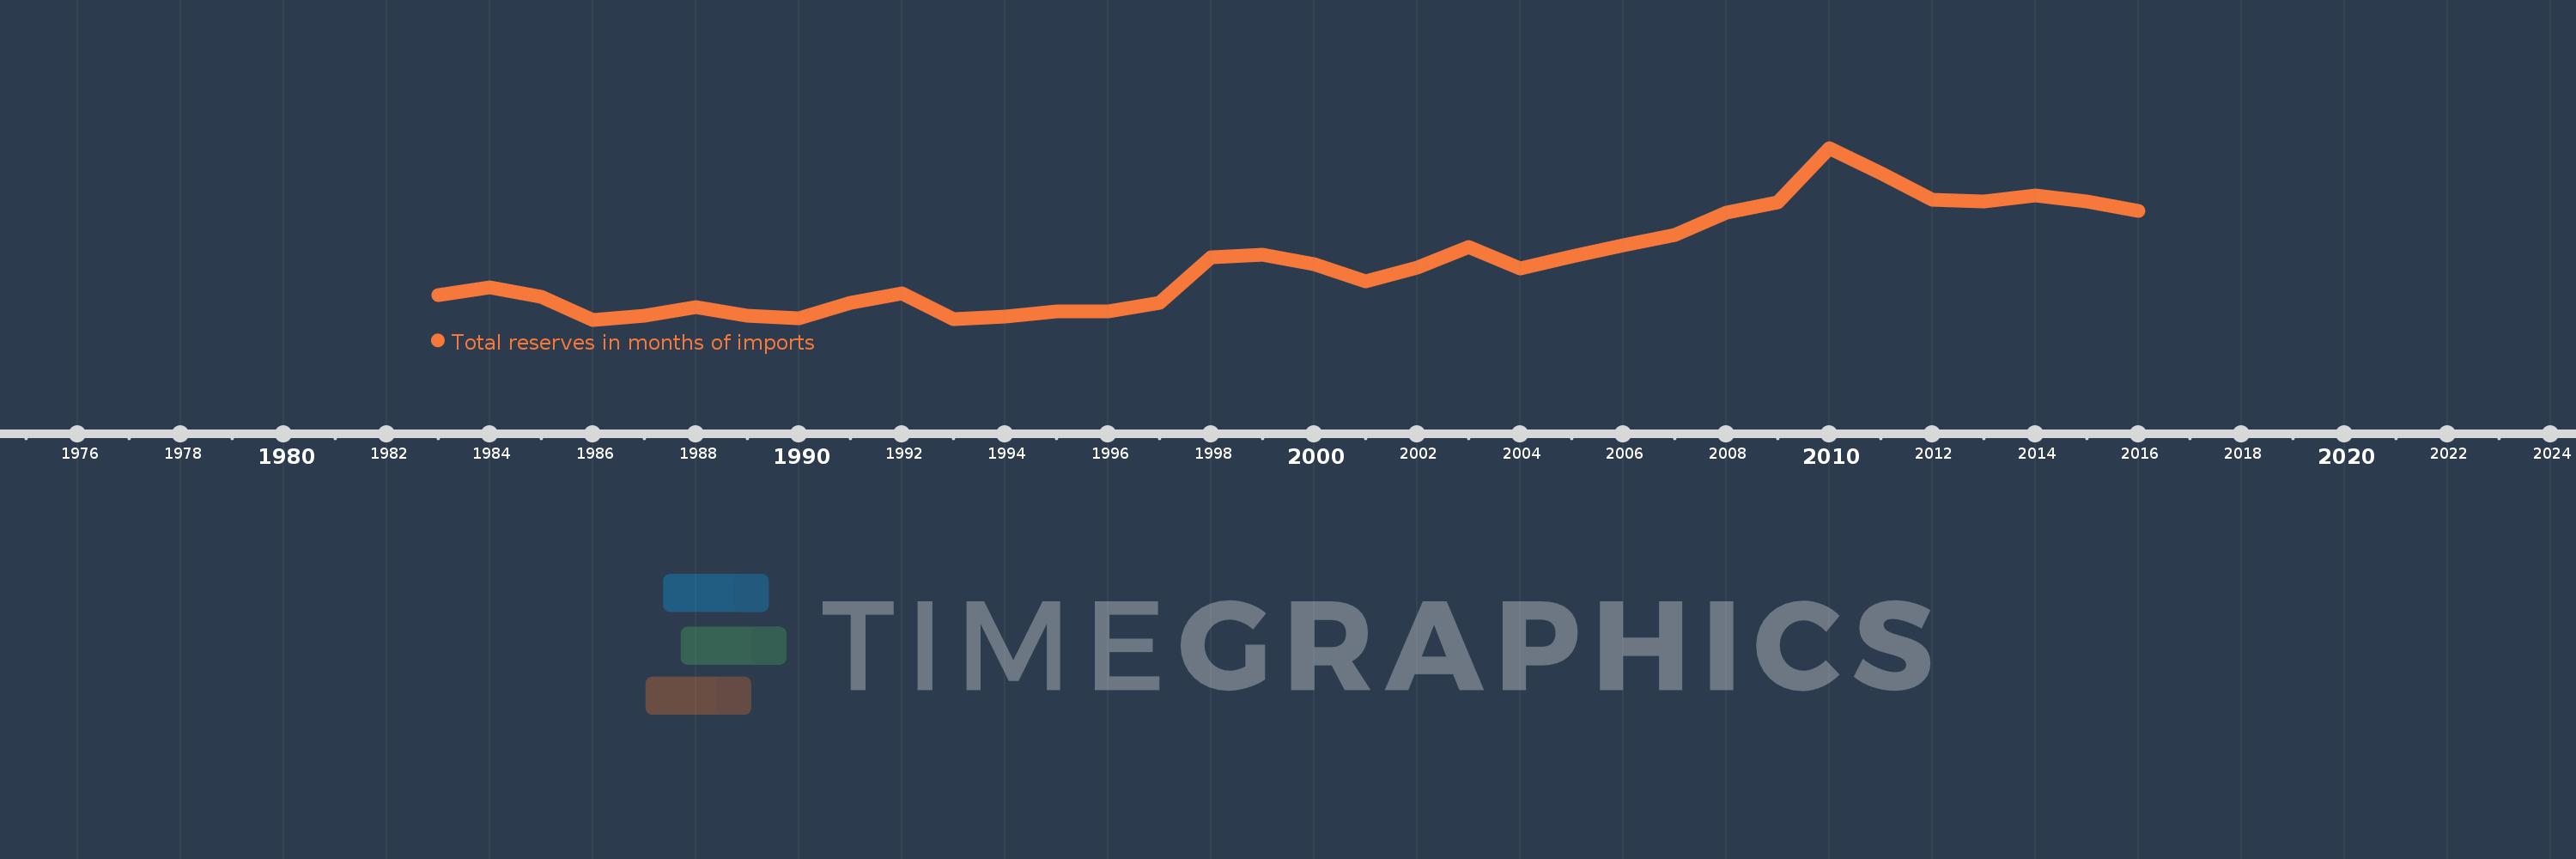
Total reserves in months of imports
2016,2015,2014,2013,2012,2011,2010,2009,2008,2007,2006,2005,2004,2003,2002,2001,2000,1999,1998,1997,1996,1995,1994,1993,1992,1991,1990,1989,1988,1987,1986,1985,1984,1983
This statistics in other country:
AfghanistanAlbaniaAlgeriaAngolaAntigua and BarbudaArab WorldArgentinaArmeniaArubaAustraliaAustriaAzerbaijanBahamas, TheBahrainBangladeshBarbadosBelarusBelgiumBelizeBeninBhutanBoliviaBosnia and HerzegovinaBotswanaBrazilBrunei DarussalamBulgariaBurkina FasoBurundiCabo VerdeCambodiaCameroonCanadaCaribbean small statesCentral African RepublicCentral Europe and the BalticsChadChileChinaColombiaComorosCongo, Dem. Rep.Congo, Rep.Costa RicaCote d'IvoireCroatiaCuracaoCyprusCzech RepublicDenmarkDjiboutiDominicaDominican RepublicEarly-demographic dividendEast Asia & PacificEast Asia & Pacific (excluding high income)East Asia & Pacific (IDA & IBRD countries)EcuadorEgypt, Arab Rep.El SalvadorEquatorial GuineaEritreaEstoniaEthiopiaEuro areaEurope & Central AsiaEurope & Central Asia (excluding high income)Europe & Central Asia (IDA & IBRD countries)European UnionFijiFinlandFragile and conflict affected situationsFranceGabonGambia, TheGeorgiaGermanyGhanaGreeceGrenadaGuatemalaGuineaGuinea-BissauGuyanaHaitiHeavily indebted poor countries (HIPC)High incomeHondurasHong Kong SAR, ChinaHungaryIBRD onlyIcelandIDA & IBRD totalIDA blendIDA onlyIDA totalIndiaIndonesiaIran, Islamic Rep.IraqIrelandIsraelItalyJamaicaJapanJordanKazakhstanKenyaKorea, Rep.KosovoKuwaitKyrgyz RepublicLao PDRLate-demographic dividendLatin America & Caribbean Latin America & Caribbean (excluding high income)Latin America & the Caribbean (IDA & IBRD countries)LatviaLeast developed countries: UN classificationLebanonLesothoLiberiaLibyaLithuaniaLow & middle incomeLow incomeLower middle incomeLuxembourgMacao SAR, ChinaMacedonia, FYRMadagascarMalawiMalaysiaMaldivesMaliMaltaMauritaniaMauritiusMexicoMicronesia, Fed. Sts.Middle East & North AfricaMiddle East & North Africa (excluding high income)Middle East & North Africa (IDA & IBRD countries)Middle incomeMoldovaMongoliaMontenegroMoroccoMozambiqueMyanmarNamibiaNepalNetherlandsNicaraguaNigerNigeriaNorth AmericaNorwayOECD membersOmanOther small statesPacific island small statesPakistanPanamaPapua New GuineaParaguayPeruPhilippinesPolandPortugalPost-demographic dividendPre-demographic dividendQatarRomaniaRussian FederationRwandaSamoaSao Tome and PrincipeSaudi ArabiaSenegalSerbiaSeychellesSierra LeoneSingaporeSlovak RepublicSloveniaSmall statesSolomon IslandsSouth AfricaSouth AsiaSouth Asia (IDA & IBRD)South SudanSpainSri LankaSt. Kitts and NevisSt. LuciaSt. Vincent and the GrenadinesSub-Saharan Africa Sub-Saharan Africa (excluding high income)Sub-Saharan Africa (IDA & IBRD countries)SudanSurinameSwazilandSwedenSwitzerlandSyrian Arab RepublicTajikistanTanzaniaThailandTimor-LesteTogoTongaTrinidad and TobagoTunisiaTurkeyUgandaUkraineUnited KingdomUnited StatesUpper middle incomeUruguayVanuatuVenezuela, RBVietnamWest Bank and GazaWorldYemen, Rep.ZambiaZimbabwe Timeline:
This timeline shows a graph from 1983 to 2016 of East Asia & Pacific (excluding high income). No data until 1982. Number of actual observations by date: 34.
Source name:
World Development Indicators
Source organization:
International Monetary Fund, International Financial Statistics and data files.
Categories, topics:
Financial Sector, External Debt
Last updated:
apr 23, 2017
Indicators value changes by year
Maximum:
23.337
jan 1, 2010
At the date of observation
Value
Absolute change
Change from previous value
jan 1, 1983
6.899
+6.899
0.0%
jan 1, 1984
7.69
+0.791
11.47%
jan 1, 1985
6.661
-1.029
-13.38%
jan 1, 1986
4.096
-2.564
-38.5%
jan 1, 1987
4.571
+0.474
11.58%
jan 1, 1988
5.511
+0.94
20.57%
jan 1, 1989
4.507
-1.003
-18.21%
jan 1, 1990
4.282
-0.225
-4.99%
jan 1, 1991
6.029
+1.747
40.78%
jan 1, 1992
7.077
+1.048
17.38%
jan 1, 1993
4.168
-2.909
-41.1%
jan 1, 1994
4.495
+0.327
7.84%
jan 1, 1995
5.015
+0.52
11.57%
jan 1, 1996
5.053
+0.038
0.75%
jan 1, 1997
5.947
+0.894
17.7%
jan 1, 1998
11.075
+5.128
86.23%
jan 1, 1999
11.377
+0.302
2.73%
jan 1, 2000
10.301
-1.076
-9.46%
jan 1, 2001
8.406
-1.895
-18.4%
jan 1, 2002
9.981
+1.575
18.74%
jan 1, 2003
12.263
+2.283
22.87%
jan 1, 2004
9.855
-2.408
-19.64%
jan 1, 2005
11.216
+1.361
13.81%
jan 1, 2006
12.438
+1.221
10.89%
jan 1, 2007
13.592
+1.154
9.28%
jan 1, 2008
16.082
+2.491
18.32%
jan 1, 2009
17.223
+1.141
7.09%
jan 1, 2010
23.337
+6.114
35.5%
jan 1, 2011
20.542
-2.795
-11.98%
jan 1, 2012
17.506
-3.036
-14.78%
jan 1, 2013
17.378
-0.128
-0.73%
jan 1, 2014
18.025
+0.647
3.72%
jan 1, 2015
17.374
-0.651
-3.61%
jan 1, 2016
16.315
-1.059
-6.1%
Ranking of countries by current statistics by years


Comments: