29
/
en
AIzaSyAYiBZKx7MnpbEhh9jyipgxe19OcubqV5w
April 1, 2024
189719
Maldives
MDV
true
2
1
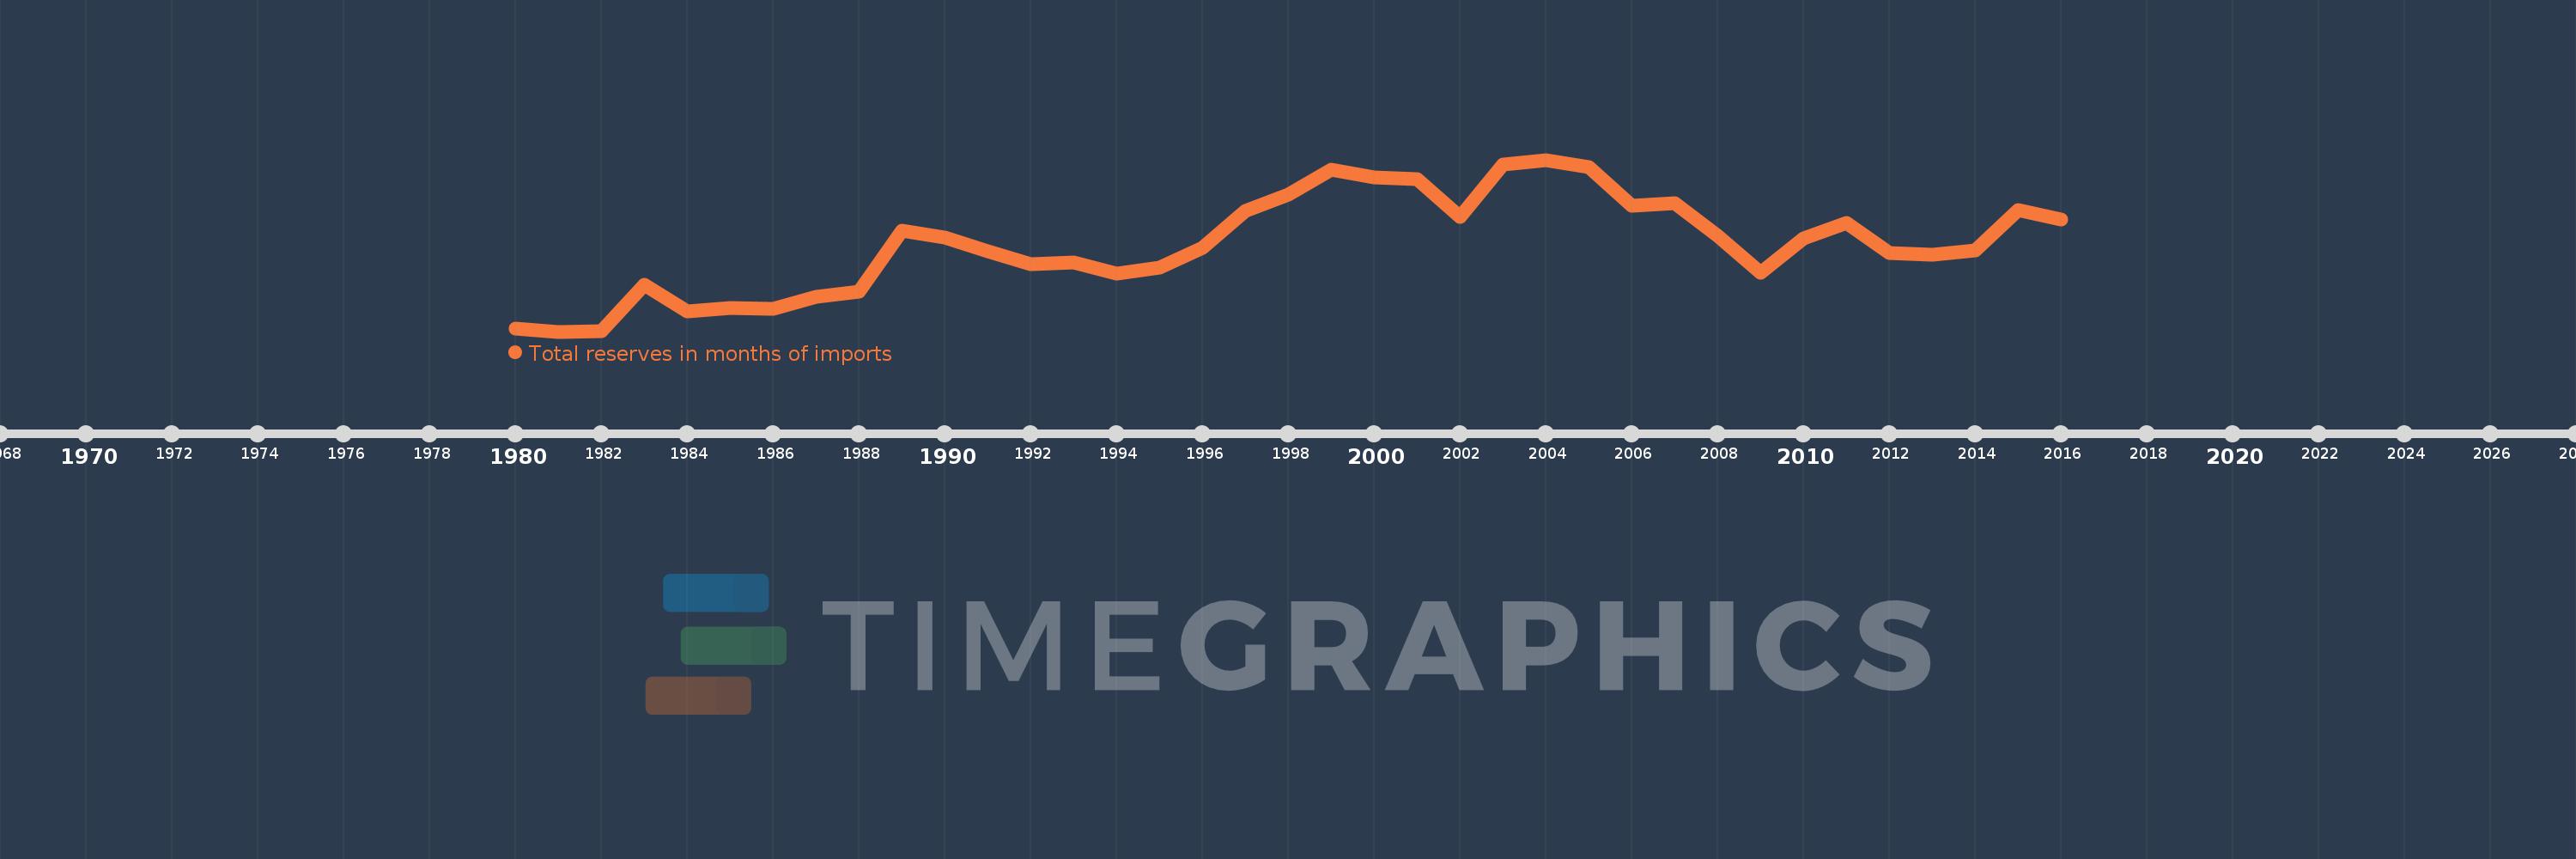
Total reserves in months of imports
2016,2015,2014,2013,2012,2011,2010,2009,2008,2007,2006,2005,2004,2003,2002,2001,2000,1999,1998,1997,1996,1995,1994,1993,1992,1991,1990,1989,1988,1987,1986,1985,1984,1983,1982,1981,1980
This statistics in other country:
AfghanistanAlbaniaAlgeriaAngolaAntigua and BarbudaArab WorldArgentinaArmeniaArubaAustraliaAustriaAzerbaijanBahamas, TheBahrainBangladeshBarbadosBelarusBelgiumBelizeBeninBhutanBoliviaBosnia and HerzegovinaBotswanaBrazilBrunei DarussalamBulgariaBurkina FasoBurundiCabo VerdeCambodiaCameroonCanadaCaribbean small statesCentral African RepublicCentral Europe and the BalticsChadChileChinaColombiaComorosCongo, Dem. Rep.Congo, Rep.Costa RicaCote d'IvoireCroatiaCuracaoCyprusCzech RepublicDenmarkDjiboutiDominicaDominican RepublicEarly-demographic dividendEast Asia & PacificEast Asia & Pacific (excluding high income)East Asia & Pacific (IDA & IBRD countries)EcuadorEgypt, Arab Rep.El SalvadorEquatorial GuineaEritreaEstoniaEthiopiaEuro areaEurope & Central AsiaEurope & Central Asia (excluding high income)Europe & Central Asia (IDA & IBRD countries)European UnionFijiFinlandFragile and conflict affected situationsFranceGabonGambia, TheGeorgiaGermanyGhanaGreeceGrenadaGuatemalaGuineaGuinea-BissauGuyanaHaitiHeavily indebted poor countries (HIPC)High incomeHondurasHong Kong SAR, ChinaHungaryIBRD onlyIcelandIDA & IBRD totalIDA blendIDA onlyIDA totalIndiaIndonesiaIran, Islamic Rep.IraqIrelandIsraelItalyJamaicaJapanJordanKazakhstanKenyaKorea, Rep.KosovoKuwaitKyrgyz RepublicLao PDRLate-demographic dividendLatin America & Caribbean Latin America & Caribbean (excluding high income)Latin America & the Caribbean (IDA & IBRD countries)LatviaLeast developed countries: UN classificationLebanonLesothoLiberiaLibyaLithuaniaLow & middle incomeLow incomeLower middle incomeLuxembourgMacao SAR, ChinaMacedonia, FYRMadagascarMalawiMalaysiaMaldivesMaliMaltaMauritaniaMauritiusMexicoMicronesia, Fed. Sts.Middle East & North AfricaMiddle East & North Africa (excluding high income)Middle East & North Africa (IDA & IBRD countries)Middle incomeMoldovaMongoliaMontenegroMoroccoMozambiqueMyanmarNamibiaNepalNetherlandsNicaraguaNigerNigeriaNorth AmericaNorwayOECD membersOmanOther small statesPacific island small statesPakistanPanamaPapua New GuineaParaguayPeruPhilippinesPolandPortugalPost-demographic dividendPre-demographic dividendQatarRomaniaRussian FederationRwandaSamoaSao Tome and PrincipeSaudi ArabiaSenegalSerbiaSeychellesSierra LeoneSingaporeSlovak RepublicSloveniaSmall statesSolomon IslandsSouth AfricaSouth AsiaSouth Asia (IDA & IBRD)South SudanSpainSri LankaSt. Kitts and NevisSt. LuciaSt. Vincent and the GrenadinesSub-Saharan Africa Sub-Saharan Africa (excluding high income)Sub-Saharan Africa (IDA & IBRD countries)SudanSurinameSwazilandSwedenSwitzerlandSyrian Arab RepublicTajikistanTanzaniaThailandTimor-LesteTogoTongaTrinidad and TobagoTunisiaTurkeyUgandaUkraineUnited KingdomUnited StatesUpper middle incomeUruguayVanuatuVenezuela, RBVietnamWest Bank and GazaWorldYemen, Rep.ZambiaZimbabwe Timeline:
This timeline shows a graph from 1980 to 2016 of Maldives. No data until 1979. Number of actual observations by date: 37.
Source name:
World Development Indicators
Source organization:
International Monetary Fund, International Financial Statistics and data files.
Categories, topics:
Financial Sector, External Debt
Last updated:
apr 23, 2017
Indicators value changes by year
At the date of observation
Value
Absolute change
Change from previous value
jan 1, 1980
0.177
+0.177
0.0%
jan 1, 1981
0.127
-0.05
-28.35%
jan 1, 1982
0.142
+0.015
11.61%
jan 1, 1983
1.015
+0.873
616.93%
jan 1, 1984
0.511
-0.504
-49.63%
jan 1, 1985
0.571
+0.06
11.71%
jan 1, 1986
0.559
-0.012
-2.03%
jan 1, 1987
0.782
+0.222
39.74%
jan 1, 1988
0.88
+0.098
12.51%
jan 1, 1989
2.033
+1.153
131.08%
jan 1, 1990
1.899
-0.133
-6.56%
jan 1, 1991
1.646
-0.253
-13.32%
jan 1, 1992
1.39
-0.256
-15.54%
jan 1, 1993
1.426
+0.035
2.55%
jan 1, 1994
1.221
-0.205
-14.35%
jan 1, 1995
1.329
+0.108
8.84%
jan 1, 1996
1.708
+0.379
28.49%
jan 1, 1997
2.397
+0.689
40.37%
jan 1, 1998
2.705
+0.308
12.84%
jan 1, 1999
3.181
+0.476
17.61%
jan 1, 2000
3.038
-0.143
-4.5%
jan 1, 2001
2.995
-0.043
-1.41%
jan 1, 2002
2.281
-0.714
-23.83%
jan 1, 2003
3.276
+0.994
43.58%
jan 1, 2004
3.362
+0.086
2.63%
jan 1, 2005
3.23
-0.131
-3.91%
jan 1, 2006
2.492
-0.739
-22.86%
jan 1, 2007
2.55
+0.059
2.36%
jan 1, 2008
1.923
-0.627
-24.58%
jan 1, 2009
1.228
-0.696
-36.17%
jan 1, 2010
1.881
+0.653
53.2%
jan 1, 2011
2.177
+0.296
15.72%
jan 1, 2012
1.612
-0.565
-25.96%
jan 1, 2013
1.576
-0.035
-2.18%
jan 1, 2014
1.656
+0.079
5.04%
jan 1, 2015
2.417
+0.761
45.97%
jan 1, 2016
2.242
-0.175
-7.23%
Ranking of countries by current statistics by years


Comments: