29
/
en
AIzaSyAYiBZKx7MnpbEhh9jyipgxe19OcubqV5w
April 1, 2024
265380
Togo
TGO
true
2
1
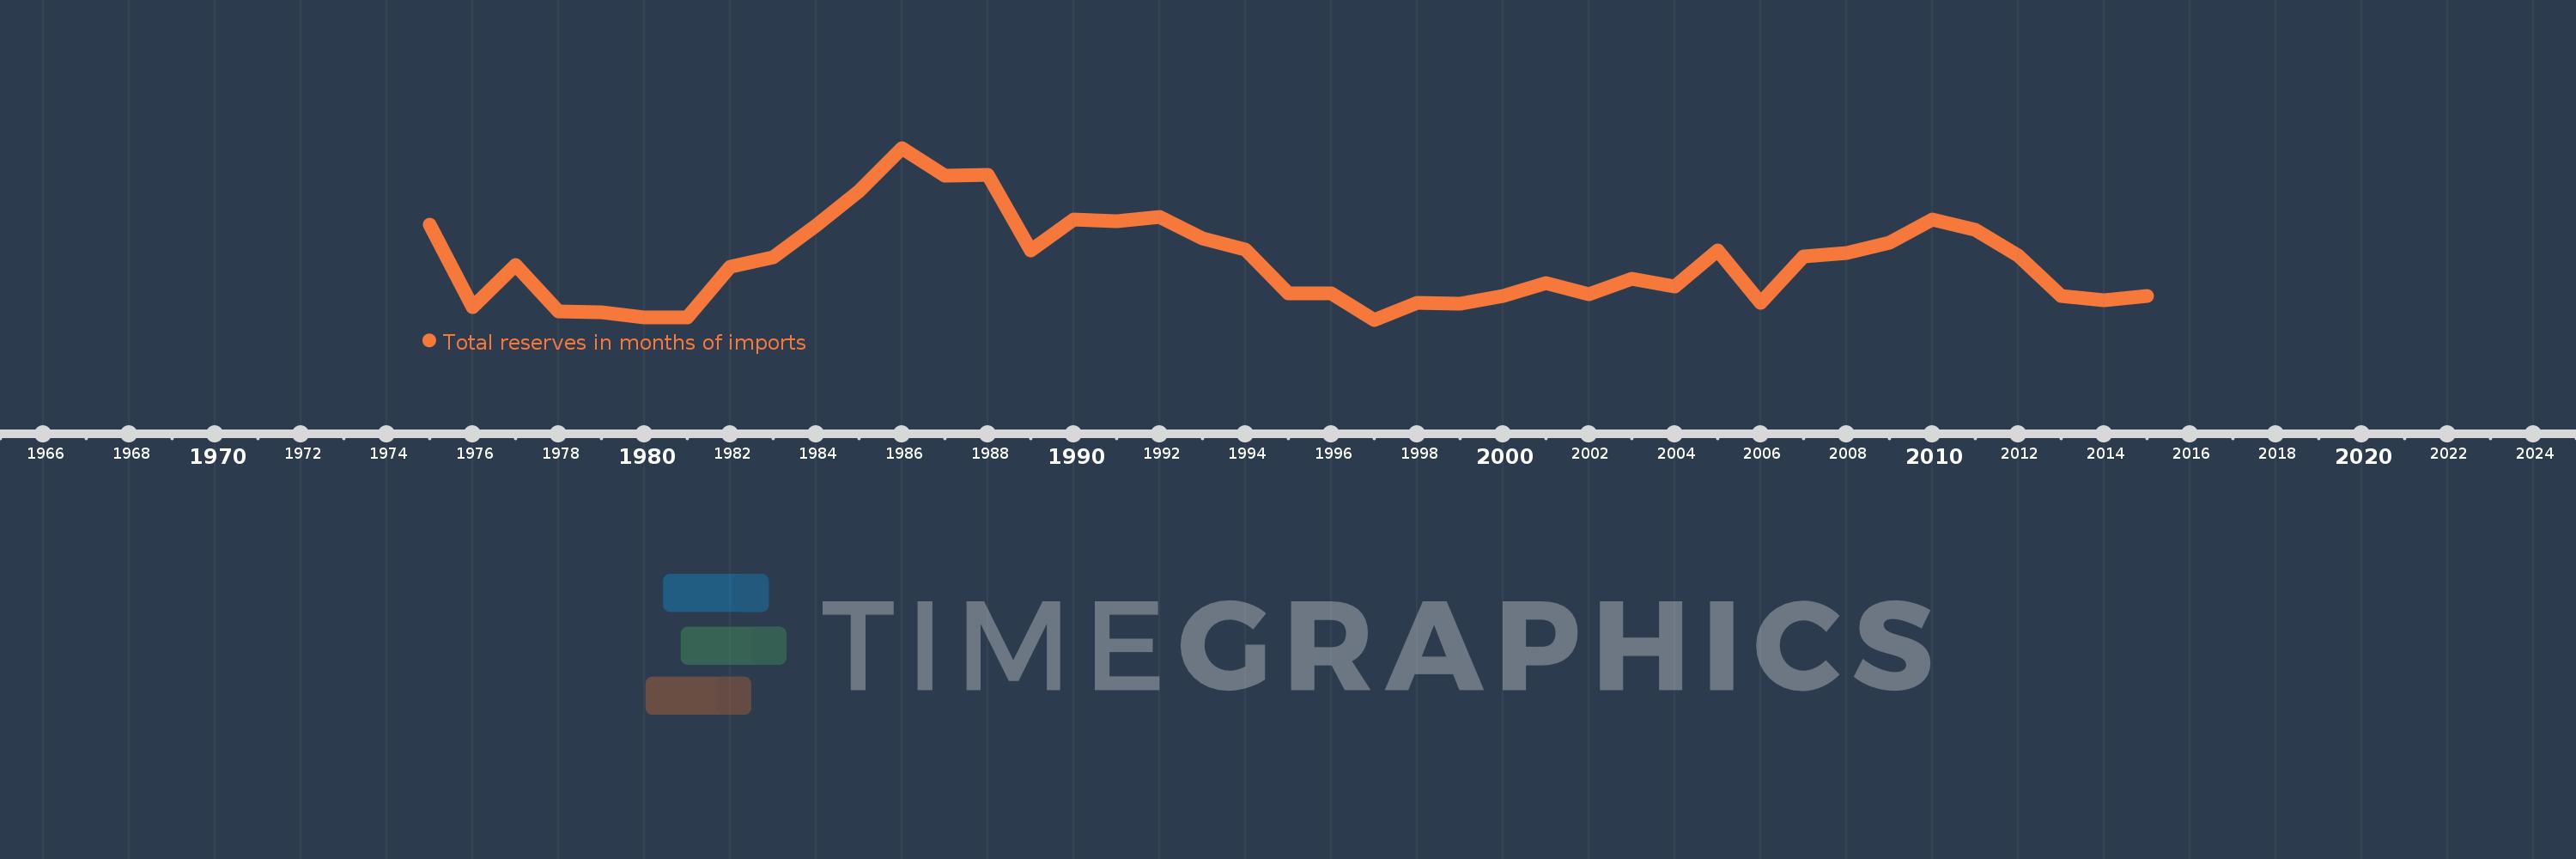
Total reserves in months of imports
2015,2014,2013,2012,2011,2010,2009,2008,2007,2006,2005,2004,2003,2002,2001,2000,1999,1998,1997,1996,1995,1994,1993,1992,1991,1990,1989,1988,1987,1986,1985,1984,1983,1982,1981,1980,1979,1978,1977,1976,1975
This statistics in other country:
AfghanistanAlbaniaAlgeriaAngolaAntigua and BarbudaArab WorldArgentinaArmeniaArubaAustraliaAustriaAzerbaijanBahamas, TheBahrainBangladeshBarbadosBelarusBelgiumBelizeBeninBhutanBoliviaBosnia and HerzegovinaBotswanaBrazilBrunei DarussalamBulgariaBurkina FasoBurundiCabo VerdeCambodiaCameroonCanadaCaribbean small statesCentral African RepublicCentral Europe and the BalticsChadChileChinaColombiaComorosCongo, Dem. Rep.Congo, Rep.Costa RicaCote d'IvoireCroatiaCuracaoCyprusCzech RepublicDenmarkDjiboutiDominicaDominican RepublicEarly-demographic dividendEast Asia & PacificEast Asia & Pacific (excluding high income)East Asia & Pacific (IDA & IBRD countries)EcuadorEgypt, Arab Rep.El SalvadorEquatorial GuineaEritreaEstoniaEthiopiaEuro areaEurope & Central AsiaEurope & Central Asia (excluding high income)Europe & Central Asia (IDA & IBRD countries)European UnionFijiFinlandFragile and conflict affected situationsFranceGabonGambia, TheGeorgiaGermanyGhanaGreeceGrenadaGuatemalaGuineaGuinea-BissauGuyanaHaitiHeavily indebted poor countries (HIPC)High incomeHondurasHong Kong SAR, ChinaHungaryIBRD onlyIcelandIDA & IBRD totalIDA blendIDA onlyIDA totalIndiaIndonesiaIran, Islamic Rep.IraqIrelandIsraelItalyJamaicaJapanJordanKazakhstanKenyaKorea, Rep.KosovoKuwaitKyrgyz RepublicLao PDRLate-demographic dividendLatin America & Caribbean Latin America & Caribbean (excluding high income)Latin America & the Caribbean (IDA & IBRD countries)LatviaLeast developed countries: UN classificationLebanonLesothoLiberiaLibyaLithuaniaLow & middle incomeLow incomeLower middle incomeLuxembourgMacao SAR, ChinaMacedonia, FYRMadagascarMalawiMalaysiaMaldivesMaliMaltaMauritaniaMauritiusMexicoMicronesia, Fed. Sts.Middle East & North AfricaMiddle East & North Africa (excluding high income)Middle East & North Africa (IDA & IBRD countries)Middle incomeMoldovaMongoliaMontenegroMoroccoMozambiqueMyanmarNamibiaNepalNetherlandsNicaraguaNigerNigeriaNorth AmericaNorwayOECD membersOmanOther small statesPacific island small statesPakistanPanamaPapua New GuineaParaguayPeruPhilippinesPolandPortugalPost-demographic dividendPre-demographic dividendQatarRomaniaRussian FederationRwandaSamoaSao Tome and PrincipeSaudi ArabiaSenegalSerbiaSeychellesSierra LeoneSingaporeSlovak RepublicSloveniaSmall statesSolomon IslandsSouth AfricaSouth AsiaSouth Asia (IDA & IBRD)South SudanSpainSri LankaSt. Kitts and NevisSt. LuciaSt. Vincent and the GrenadinesSub-Saharan Africa Sub-Saharan Africa (excluding high income)Sub-Saharan Africa (IDA & IBRD countries)SudanSurinameSwazilandSwedenSwitzerlandSyrian Arab RepublicTajikistanTanzaniaThailandTimor-LesteTogoTongaTrinidad and TobagoTunisiaTurkeyUgandaUkraineUnited KingdomUnited StatesUpper middle incomeUruguayVanuatuVenezuela, RBVietnamWest Bank and GazaWorldYemen, Rep.ZambiaZimbabwe Timeline:
This timeline shows a graph from 1975 to 2015 of Togo. No data until 1974. Number of actual observations by date: 41.
Source name:
World Development Indicators
Source organization:
International Monetary Fund, International Financial Statistics and data files.
Categories, topics:
Financial Sector, External Debt
Last updated:
apr 23, 2017
Indicators value changes by year
At the date of observation
Value
Absolute change
Change from previous value
jan 1, 1975
4.595
+4.595
0.0%
jan 1, 1976
1.693
-2.902
-63.15%
jan 1, 1977
3.185
+1.492
88.12%
jan 1, 1978
1.559
-1.626
-51.06%
jan 1, 1979
1.512
-0.047
-3.02%
jan 1, 1980
1.344
-0.168
-11.12%
jan 1, 1981
1.356
+0.012
0.93%
jan 1, 1982
3.113
+1.756
129.5%
jan 1, 1983
3.449
+0.337
10.81%
jan 1, 1984
4.547
+1.098
31.83%
jan 1, 1985
5.757
+1.21
26.61%
jan 1, 1986
7.259
+1.502
26.1%
jan 1, 1987
6.303
-0.956
-13.18%
jan 1, 1988
6.327
+0.024
0.39%
jan 1, 1989
3.673
-2.655
-41.95%
jan 1, 1990
4.773
+1.101
29.97%
jan 1, 1991
4.71
-0.063
-1.32%
jan 1, 1992
4.86
+0.149
3.17%
jan 1, 1993
4.102
-0.757
-15.58%
jan 1, 1994
3.712
-0.391
-9.52%
jan 1, 1995
2.185
-1.527
-41.13%
jan 1, 1996
2.194
+0.009
0.42%
jan 1, 1997
1.262
-0.932
-42.47%
jan 1, 1998
1.867
+0.605
47.91%
jan 1, 1999
1.834
-0.033
-1.78%
jan 1, 2000
2.097
+0.263
14.33%
jan 1, 2001
2.545
+0.448
21.39%
jan 1, 2002
2.159
-0.386
-15.17%
jan 1, 2003
2.683
+0.524
24.26%
jan 1, 2004
2.437
-0.246
-9.17%
jan 1, 2005
3.677
+1.241
50.91%
jan 1, 2006
1.84
-1.837
-49.96%
jan 1, 2007
3.46
+1.62
88.03%
jan 1, 2008
3.579
+0.119
3.43%
jan 1, 2009
3.961
+0.382
10.68%
jan 1, 2010
4.748
+0.786
19.85%
jan 1, 2011
4.397
-0.351
-7.39%
jan 1, 2012
3.505
-0.892
-20.29%
jan 1, 2013
2.085
-1.419
-40.5%
jan 1, 2014
1.932
-0.153
-7.33%
jan 1, 2015
2.084
+0.152
7.85%
Ranking of countries by current statistics by years


Comments: