29
/
en
AIzaSyAYiBZKx7MnpbEhh9jyipgxe19OcubqV5w
April 1, 2024
77705
Bahrain
BHR
true
2
1
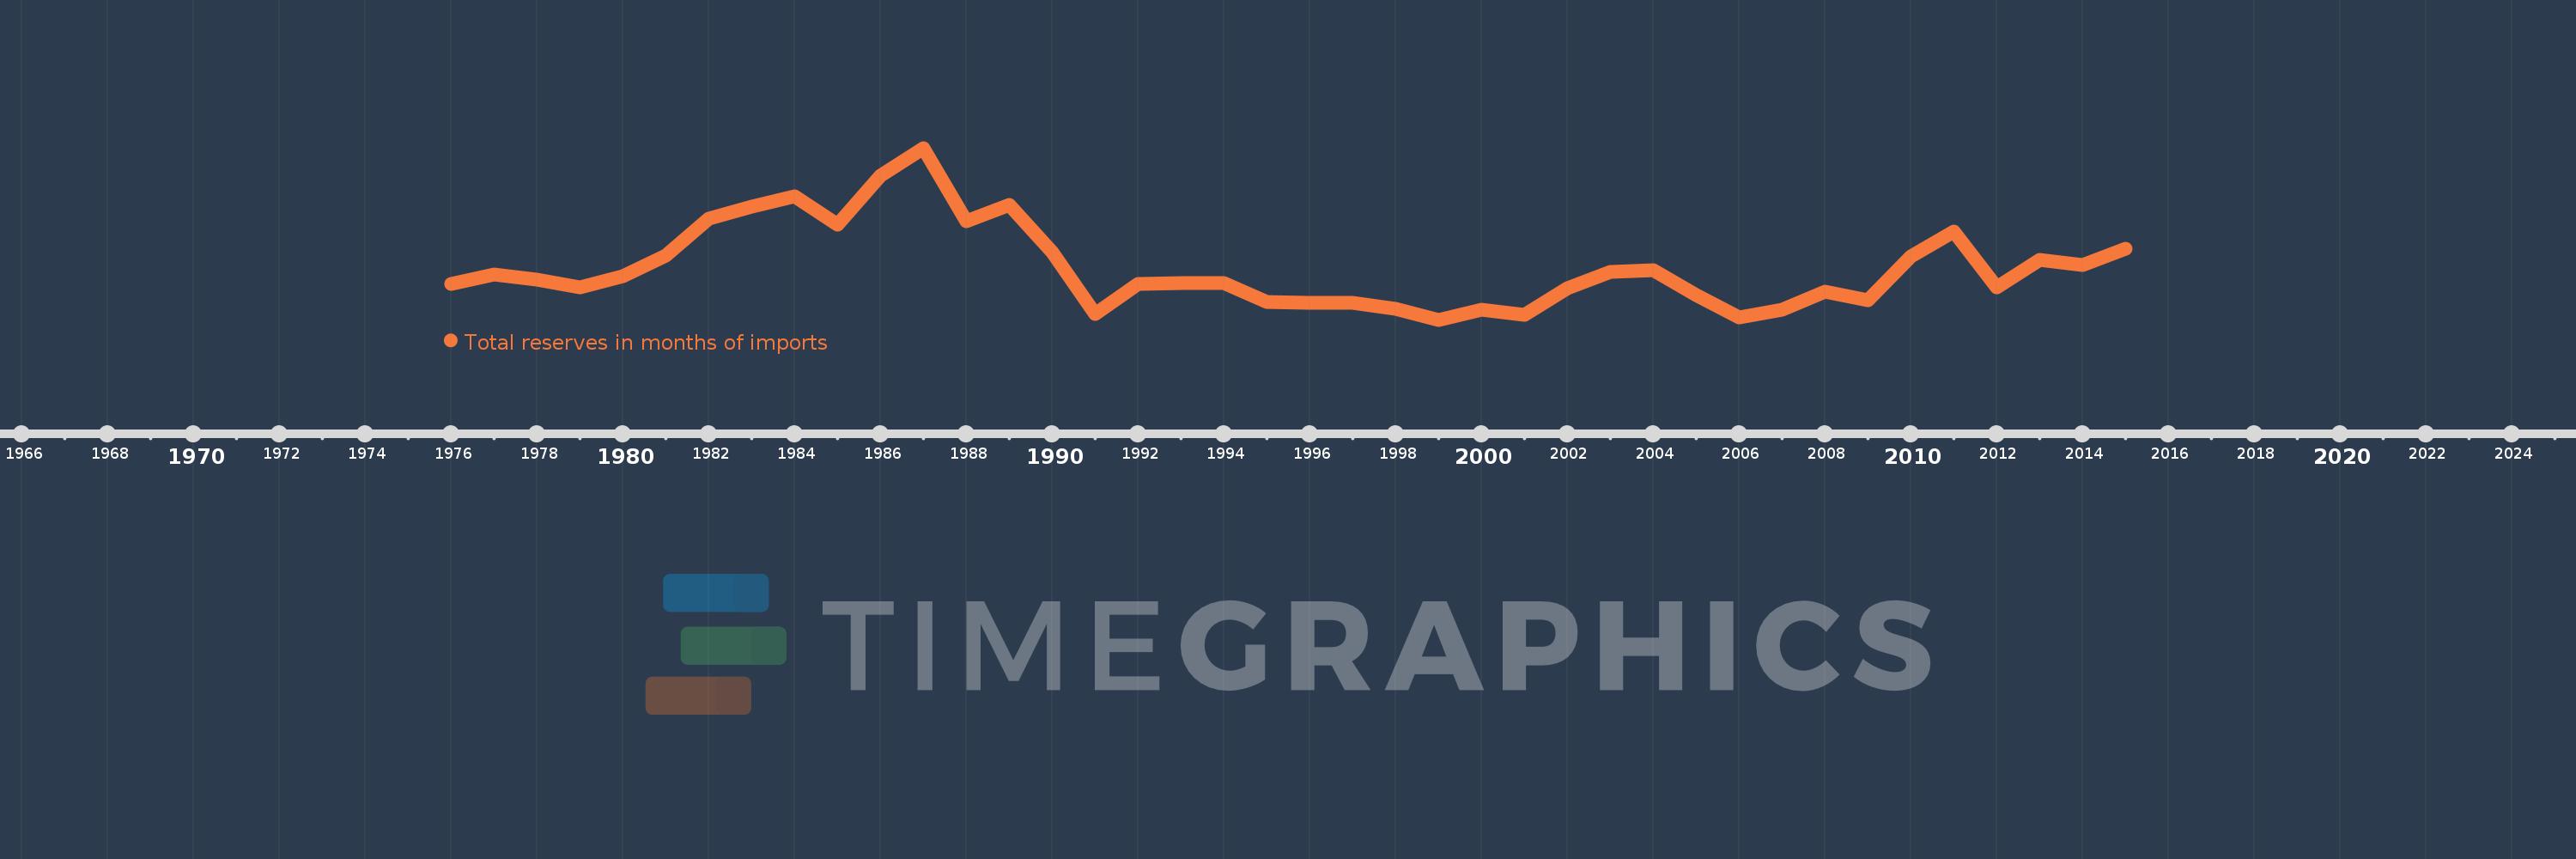
Total reserves in months of imports
2015,2014,2013,2012,2011,2010,2009,2008,2007,2006,2005,2004,2003,2002,2001,2000,1999,1998,1997,1996,1995,1994,1993,1992,1991,1990,1989,1988,1987,1986,1985,1984,1983,1982,1981,1980,1979,1978,1977,1976
This statistics in other country:
AfghanistanAlbaniaAlgeriaAngolaAntigua and BarbudaArab WorldArgentinaArmeniaArubaAustraliaAustriaAzerbaijanBahamas, TheBahrainBangladeshBarbadosBelarusBelgiumBelizeBeninBhutanBoliviaBosnia and HerzegovinaBotswanaBrazilBrunei DarussalamBulgariaBurkina FasoBurundiCabo VerdeCambodiaCameroonCanadaCaribbean small statesCentral African RepublicCentral Europe and the BalticsChadChileChinaColombiaComorosCongo, Dem. Rep.Congo, Rep.Costa RicaCote d'IvoireCroatiaCuracaoCyprusCzech RepublicDenmarkDjiboutiDominicaDominican RepublicEarly-demographic dividendEast Asia & PacificEast Asia & Pacific (excluding high income)East Asia & Pacific (IDA & IBRD countries)EcuadorEgypt, Arab Rep.El SalvadorEquatorial GuineaEritreaEstoniaEthiopiaEuro areaEurope & Central AsiaEurope & Central Asia (excluding high income)Europe & Central Asia (IDA & IBRD countries)European UnionFijiFinlandFragile and conflict affected situationsFranceGabonGambia, TheGeorgiaGermanyGhanaGreeceGrenadaGuatemalaGuineaGuinea-BissauGuyanaHaitiHeavily indebted poor countries (HIPC)High incomeHondurasHong Kong SAR, ChinaHungaryIBRD onlyIcelandIDA & IBRD totalIDA blendIDA onlyIDA totalIndiaIndonesiaIran, Islamic Rep.IraqIrelandIsraelItalyJamaicaJapanJordanKazakhstanKenyaKorea, Rep.KosovoKuwaitKyrgyz RepublicLao PDRLate-demographic dividendLatin America & Caribbean Latin America & Caribbean (excluding high income)Latin America & the Caribbean (IDA & IBRD countries)LatviaLeast developed countries: UN classificationLebanonLesothoLiberiaLibyaLithuaniaLow & middle incomeLow incomeLower middle incomeLuxembourgMacao SAR, ChinaMacedonia, FYRMadagascarMalawiMalaysiaMaldivesMaliMaltaMauritaniaMauritiusMexicoMicronesia, Fed. Sts.Middle East & North AfricaMiddle East & North Africa (excluding high income)Middle East & North Africa (IDA & IBRD countries)Middle incomeMoldovaMongoliaMontenegroMoroccoMozambiqueMyanmarNamibiaNepalNetherlandsNicaraguaNigerNigeriaNorth AmericaNorwayOECD membersOmanOther small statesPacific island small statesPakistanPanamaPapua New GuineaParaguayPeruPhilippinesPolandPortugalPost-demographic dividendPre-demographic dividendQatarRomaniaRussian FederationRwandaSamoaSao Tome and PrincipeSaudi ArabiaSenegalSerbiaSeychellesSierra LeoneSingaporeSlovak RepublicSloveniaSmall statesSolomon IslandsSouth AfricaSouth AsiaSouth Asia (IDA & IBRD)South SudanSpainSri LankaSt. Kitts and NevisSt. LuciaSt. Vincent and the GrenadinesSub-Saharan Africa Sub-Saharan Africa (excluding high income)Sub-Saharan Africa (IDA & IBRD countries)SudanSurinameSwazilandSwedenSwitzerlandSyrian Arab RepublicTajikistanTanzaniaThailandTimor-LesteTogoTongaTrinidad and TobagoTunisiaTurkeyUgandaUkraineUnited KingdomUnited StatesUpper middle incomeUruguayVanuatuVenezuela, RBVietnamWest Bank and GazaWorldYemen, Rep.ZambiaZimbabwe Timeline:
This timeline shows a graph from 1976 to 2015 of Bahrain. No data until 1975. Number of actual observations by date: 40.
Source name:
World Development Indicators
Source organization:
International Monetary Fund, International Financial Statistics and data files.
Categories, topics:
Financial Sector, External Debt
Last updated:
apr 23, 2017
Indicators value changes by year
At the date of observation
Value
Absolute change
Change from previous value
jan 1, 1976
2.433
+2.433
0.0%
jan 1, 1977
2.656
+0.223
9.18%
jan 1, 1978
2.535
-0.122
-4.58%
jan 1, 1979
2.335
-0.2
-7.88%
jan 1, 1980
2.629
+0.294
12.6%
jan 1, 1981
3.138
+0.509
19.36%
jan 1, 1982
4.082
+0.944
30.08%
jan 1, 1983
4.374
+0.291
7.14%
jan 1, 1984
4.637
+0.263
6.01%
jan 1, 1985
3.915
-0.722
-15.57%
jan 1, 1986
5.155
+1.241
31.69%
jan 1, 1987
5.866
+0.711
13.78%
jan 1, 1988
4.019
-1.847
-31.48%
jan 1, 1989
4.43
+0.41
10.21%
jan 1, 1990
3.238
-1.192
-26.91%
jan 1, 1991
1.673
-1.565
-48.34%
jan 1, 1992
2.43
+0.758
45.29%
jan 1, 1993
2.452
+0.022
0.89%
jan 1, 1994
2.446
-0.006
-0.23%
jan 1, 1995
1.97
-0.476
-19.45%
jan 1, 1996
1.942
-0.028
-1.44%
jan 1, 1997
1.942
0.0
0.0%
jan 1, 1998
1.794
-0.147
-7.59%
jan 1, 1999
1.517
-0.277
-15.44%
jan 1, 2000
1.774
+0.256
16.89%
jan 1, 2001
1.649
-0.125
-7.03%
jan 1, 2002
2.324
+0.675
40.93%
jan 1, 2003
2.724
+0.401
17.25%
jan 1, 2004
2.774
+0.049
1.81%
jan 1, 2005
2.132
-0.641
-23.12%
jan 1, 2006
1.567
-0.566
-26.52%
jan 1, 2007
1.775
+0.208
13.28%
jan 1, 2008
2.236
+0.462
26.01%
jan 1, 2009
2.001
-0.235
-10.51%
jan 1, 2010
3.116
+1.115
55.71%
jan 1, 2011
3.755
+0.638
20.49%
jan 1, 2012
2.341
-1.414
-37.65%
jan 1, 2013
3.037
+0.695
29.7%
jan 1, 2014
2.906
-0.131
-4.31%
jan 1, 2015
3.315
+0.409
14.07%
Ranking of countries by current statistics by years


Comments: