29
/
en
AIzaSyAYiBZKx7MnpbEhh9jyipgxe19OcubqV5w
April 1, 2024
62280
Upper middle income
UMC
false
2
1
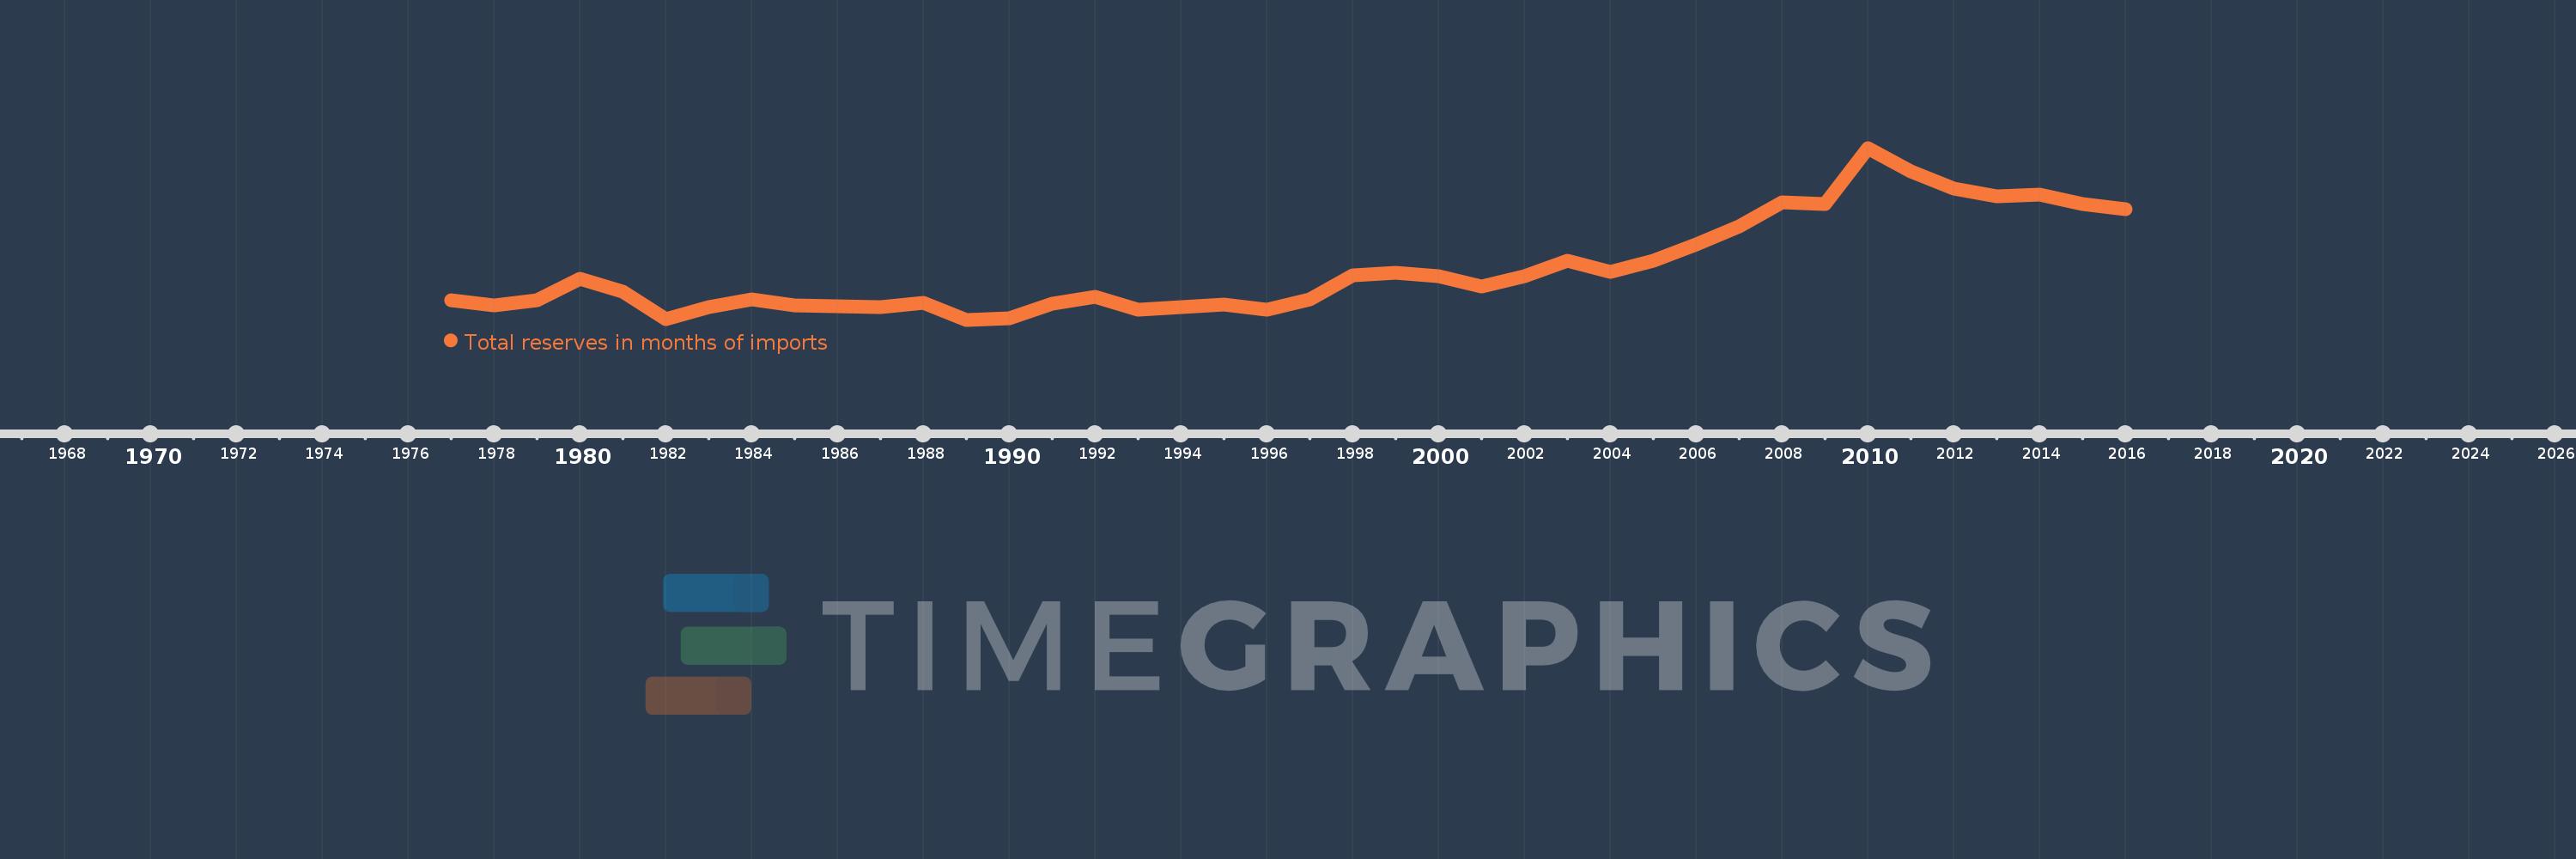
Total reserves in months of imports
2016,2015,2014,2013,2012,2011,2010,2009,2008,2007,2006,2005,2004,2003,2002,2001,2000,1999,1998,1997,1996,1995,1994,1993,1992,1991,1990,1989,1988,1987,1986,1985,1984,1983,1982,1981,1980,1979,1978,1977
This statistics in other country:
AfghanistanAlbaniaAlgeriaAngolaAntigua and BarbudaArab WorldArgentinaArmeniaArubaAustraliaAustriaAzerbaijanBahamas, TheBahrainBangladeshBarbadosBelarusBelgiumBelizeBeninBhutanBoliviaBosnia and HerzegovinaBotswanaBrazilBrunei DarussalamBulgariaBurkina FasoBurundiCabo VerdeCambodiaCameroonCanadaCaribbean small statesCentral African RepublicCentral Europe and the BalticsChadChileChinaColombiaComorosCongo, Dem. Rep.Congo, Rep.Costa RicaCote d'IvoireCroatiaCuracaoCyprusCzech RepublicDenmarkDjiboutiDominicaDominican RepublicEarly-demographic dividendEast Asia & PacificEast Asia & Pacific (excluding high income)East Asia & Pacific (IDA & IBRD countries)EcuadorEgypt, Arab Rep.El SalvadorEquatorial GuineaEritreaEstoniaEthiopiaEuro areaEurope & Central AsiaEurope & Central Asia (excluding high income)Europe & Central Asia (IDA & IBRD countries)European UnionFijiFinlandFragile and conflict affected situationsFranceGabonGambia, TheGeorgiaGermanyGhanaGreeceGrenadaGuatemalaGuineaGuinea-BissauGuyanaHaitiHeavily indebted poor countries (HIPC)High incomeHondurasHong Kong SAR, ChinaHungaryIBRD onlyIcelandIDA & IBRD totalIDA blendIDA onlyIDA totalIndiaIndonesiaIran, Islamic Rep.IraqIrelandIsraelItalyJamaicaJapanJordanKazakhstanKenyaKorea, Rep.KosovoKuwaitKyrgyz RepublicLao PDRLate-demographic dividendLatin America & Caribbean Latin America & Caribbean (excluding high income)Latin America & the Caribbean (IDA & IBRD countries)LatviaLeast developed countries: UN classificationLebanonLesothoLiberiaLibyaLithuaniaLow & middle incomeLow incomeLower middle incomeLuxembourgMacao SAR, ChinaMacedonia, FYRMadagascarMalawiMalaysiaMaldivesMaliMaltaMauritaniaMauritiusMexicoMicronesia, Fed. Sts.Middle East & North AfricaMiddle East & North Africa (excluding high income)Middle East & North Africa (IDA & IBRD countries)Middle incomeMoldovaMongoliaMontenegroMoroccoMozambiqueMyanmarNamibiaNepalNetherlandsNicaraguaNigerNigeriaNorth AmericaNorwayOECD membersOmanOther small statesPacific island small statesPakistanPanamaPapua New GuineaParaguayPeruPhilippinesPolandPortugalPost-demographic dividendPre-demographic dividendQatarRomaniaRussian FederationRwandaSamoaSao Tome and PrincipeSaudi ArabiaSenegalSerbiaSeychellesSierra LeoneSingaporeSlovak RepublicSloveniaSmall statesSolomon IslandsSouth AfricaSouth AsiaSouth Asia (IDA & IBRD)South SudanSpainSri LankaSt. Kitts and NevisSt. LuciaSt. Vincent and the GrenadinesSub-Saharan Africa Sub-Saharan Africa (excluding high income)Sub-Saharan Africa (IDA & IBRD countries)SudanSurinameSwazilandSwedenSwitzerlandSyrian Arab RepublicTajikistanTanzaniaThailandTimor-LesteTogoTongaTrinidad and TobagoTunisiaTurkeyUgandaUkraineUnited KingdomUnited StatesUpper middle incomeUruguayVanuatuVenezuela, RBVietnamWest Bank and GazaWorldYemen, Rep.ZambiaZimbabwe Timeline:
This timeline shows a graph from 1977 to 2016 of Upper middle income. No data until 1976. Number of actual observations by date: 40.
Source name:
World Development Indicators
Source organization:
International Monetary Fund, International Financial Statistics and data files.
Categories, topics:
Financial Sector, External Debt
Last updated:
apr 23, 2017
Indicators value changes by year
At the date of observation
Value
Absolute change
Change from previous value
jan 1, 1978
6.06
-0.44
-6.77%
jan 1, 1979
6.505
+0.445
7.35%
jan 1, 1980
8.608
+2.103
32.33%
jan 1, 1981
7.327
-1.281
-14.88%
jan 1, 1982
4.736
-2.591
-35.36%
jan 1, 1983
5.844
+1.108
23.39%
jan 1, 1984
6.617
+0.773
13.23%
jan 1, 1985
5.987
-0.629
-9.51%
jan 1, 1986
5.972
-0.015
-0.25%
jan 1, 1987
5.852
-0.12
-2.01%
jan 1, 1988
6.277
+0.425
7.26%
jan 1, 1989
4.647
-1.629
-25.96%
jan 1, 1990
4.775
+0.128
2.75%
jan 1, 1991
6.221
+1.446
30.28%
jan 1, 1992
6.856
+0.635
10.2%
jan 1, 1993
5.623
-1.233
-17.98%
jan 1, 1994
5.896
+0.273
4.86%
jan 1, 1995
6.094
+0.198
3.35%
jan 1, 1996
5.624
-0.47
-7.71%
jan 1, 1997
6.581
+0.957
17.01%
jan 1, 1998
8.875
+2.294
34.85%
jan 1, 1999
9.153
+0.279
3.14%
jan 1, 2000
8.841
-0.313
-3.42%
jan 1, 2001
7.796
-1.044
-11.81%
jan 1, 2002
8.782
+0.986
12.65%
jan 1, 2003
10.331
+1.548
17.63%
jan 1, 2004
9.272
-1.059
-10.25%
jan 1, 2005
10.325
+1.053
11.35%
jan 1, 2006
11.838
+1.513
14.66%
jan 1, 2007
13.587
+1.749
14.77%
jan 1, 2008
15.938
+2.35
17.3%
jan 1, 2009
15.775
-0.163
-1.02%
jan 1, 2010
21.12
+5.346
33.89%
jan 1, 2011
18.878
-2.242
-10.62%
jan 1, 2012
17.253
-1.625
-8.61%
jan 1, 2013
16.508
-0.745
-4.32%
jan 1, 2014
16.654
+0.145
0.88%
jan 1, 2015
15.708
-0.946
-5.68%
jan 1, 2016
15.241
-0.467
-2.97%
Ranking of countries by current statistics by years


Comments: