29
/
en
AIzaSyAYiBZKx7MnpbEhh9jyipgxe19OcubqV5w
April 1, 2024
261714
Tanzania
TZA
true
2
1
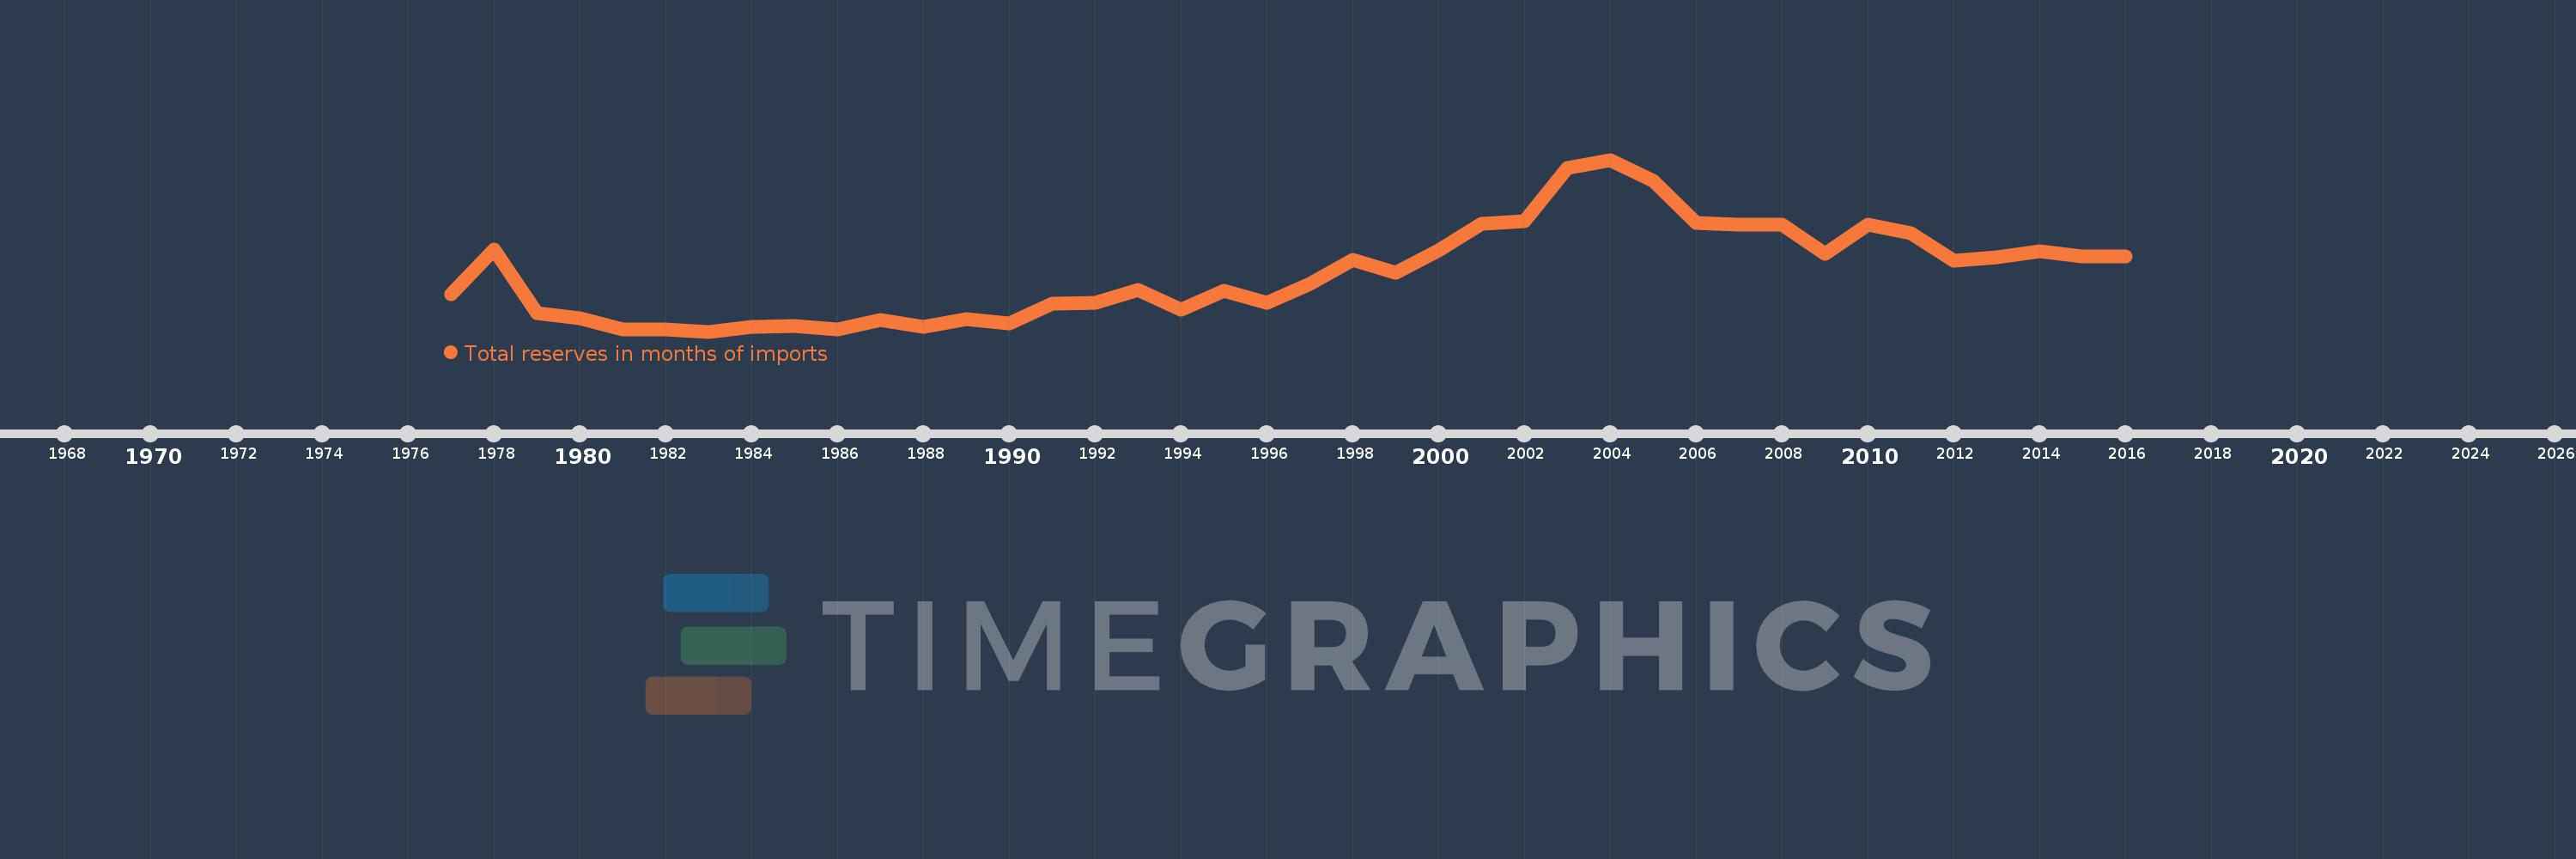
Total reserves in months of imports
2016,2015,2014,2013,2012,2011,2010,2009,2008,2007,2006,2005,2004,2003,2002,2001,2000,1999,1998,1997,1996,1995,1994,1993,1992,1991,1990,1989,1988,1987,1986,1985,1984,1983,1982,1981,1980,1979,1978,1977
This statistics in other country:
AfghanistanAlbaniaAlgeriaAngolaAntigua and BarbudaArab WorldArgentinaArmeniaArubaAustraliaAustriaAzerbaijanBahamas, TheBahrainBangladeshBarbadosBelarusBelgiumBelizeBeninBhutanBoliviaBosnia and HerzegovinaBotswanaBrazilBrunei DarussalamBulgariaBurkina FasoBurundiCabo VerdeCambodiaCameroonCanadaCaribbean small statesCentral African RepublicCentral Europe and the BalticsChadChileChinaColombiaComorosCongo, Dem. Rep.Congo, Rep.Costa RicaCote d'IvoireCroatiaCuracaoCyprusCzech RepublicDenmarkDjiboutiDominicaDominican RepublicEarly-demographic dividendEast Asia & PacificEast Asia & Pacific (excluding high income)East Asia & Pacific (IDA & IBRD countries)EcuadorEgypt, Arab Rep.El SalvadorEquatorial GuineaEritreaEstoniaEthiopiaEuro areaEurope & Central AsiaEurope & Central Asia (excluding high income)Europe & Central Asia (IDA & IBRD countries)European UnionFijiFinlandFragile and conflict affected situationsFranceGabonGambia, TheGeorgiaGermanyGhanaGreeceGrenadaGuatemalaGuineaGuinea-BissauGuyanaHaitiHeavily indebted poor countries (HIPC)High incomeHondurasHong Kong SAR, ChinaHungaryIBRD onlyIcelandIDA & IBRD totalIDA blendIDA onlyIDA totalIndiaIndonesiaIran, Islamic Rep.IraqIrelandIsraelItalyJamaicaJapanJordanKazakhstanKenyaKorea, Rep.KosovoKuwaitKyrgyz RepublicLao PDRLate-demographic dividendLatin America & Caribbean Latin America & Caribbean (excluding high income)Latin America & the Caribbean (IDA & IBRD countries)LatviaLeast developed countries: UN classificationLebanonLesothoLiberiaLibyaLithuaniaLow & middle incomeLow incomeLower middle incomeLuxembourgMacao SAR, ChinaMacedonia, FYRMadagascarMalawiMalaysiaMaldivesMaliMaltaMauritaniaMauritiusMexicoMicronesia, Fed. Sts.Middle East & North AfricaMiddle East & North Africa (excluding high income)Middle East & North Africa (IDA & IBRD countries)Middle incomeMoldovaMongoliaMontenegroMoroccoMozambiqueMyanmarNamibiaNepalNetherlandsNicaraguaNigerNigeriaNorth AmericaNorwayOECD membersOmanOther small statesPacific island small statesPakistanPanamaPapua New GuineaParaguayPeruPhilippinesPolandPortugalPost-demographic dividendPre-demographic dividendQatarRomaniaRussian FederationRwandaSamoaSao Tome and PrincipeSaudi ArabiaSenegalSerbiaSeychellesSierra LeoneSingaporeSlovak RepublicSloveniaSmall statesSolomon IslandsSouth AfricaSouth AsiaSouth Asia (IDA & IBRD)South SudanSpainSri LankaSt. Kitts and NevisSt. LuciaSt. Vincent and the GrenadinesSub-Saharan Africa Sub-Saharan Africa (excluding high income)Sub-Saharan Africa (IDA & IBRD countries)SudanSurinameSwazilandSwedenSwitzerlandSyrian Arab RepublicTajikistanTanzaniaThailandTimor-LesteTogoTongaTrinidad and TobagoTunisiaTurkeyUgandaUkraineUnited KingdomUnited StatesUpper middle incomeUruguayVanuatuVenezuela, RBVietnamWest Bank and GazaWorldYemen, Rep.ZambiaZimbabwe Timeline:
This timeline shows a graph from 1977 to 2016 of Tanzania. No data until 1976. Number of actual observations by date: 40.
Source name:
World Development Indicators
Source organization:
International Monetary Fund, International Financial Statistics and data files.
Categories, topics:
Financial Sector, External Debt
Last updated:
apr 23, 2017
Indicators value changes by year
At the date of observation
Value
Absolute change
Change from previous value
jan 1, 1977
1.865
+1.865
0.0%
jan 1, 1978
4.014
+2.149
115.22%
jan 1, 1979
0.949
-3.065
-76.35%
jan 1, 1980
0.67
-0.279
-29.4%
jan 1, 1981
0.173
-0.498
-74.25%
jan 1, 1982
0.168
-0.005
-2.69%
jan 1, 1983
0.049
-0.119
-70.61%
jan 1, 1984
0.259
+0.21
425.15%
jan 1, 1985
0.315
+0.056
21.47%
jan 1, 1986
0.163
-0.152
-48.23%
jan 1, 1987
0.591
+0.428
262.47%
jan 1, 1988
0.275
-0.316
-53.5%
jan 1, 1989
0.628
+0.353
128.7%
jan 1, 1990
0.427
-0.201
-32.08%
jan 1, 1991
1.39
+0.963
225.75%
jan 1, 1992
1.421
+0.031
2.23%
jan 1, 1993
2.053
+0.632
44.52%
jan 1, 1994
1.112
-0.941
-45.82%
jan 1, 1995
2.027
+0.915
82.23%
jan 1, 1996
1.421
-0.606
-29.88%
jan 1, 1997
2.325
+0.903
63.56%
jan 1, 1998
3.505
+1.18
50.77%
jan 1, 1999
2.887
-0.617
-17.62%
jan 1, 2000
3.945
+1.058
36.65%
jan 1, 2001
5.242
+1.296
32.85%
jan 1, 2002
5.368
+0.126
2.4%
jan 1, 2003
7.945
+2.577
48.01%
jan 1, 2004
8.318
+0.373
4.7%
jan 1, 2005
7.309
-1.009
-12.13%
jan 1, 2006
5.298
-2.011
-27.52%
jan 1, 2007
5.197
-0.1
-1.89%
jan 1, 2008
5.198
+0.001
0.01%
jan 1, 2009
3.771
-1.427
-27.46%
jan 1, 2010
5.196
+1.425
37.8%
jan 1, 2011
4.785
-0.411
-7.91%
jan 1, 2012
3.475
-1.31
-27.37%
jan 1, 2013
3.633
+0.158
4.54%
jan 1, 2014
3.907
+0.274
7.54%
jan 1, 2015
3.676
-0.231
-5.91%
jan 1, 2016
3.658
-0.019
-0.51%
Ranking of countries by current statistics by years


Comments: