29
/
en
AIzaSyAYiBZKx7MnpbEhh9jyipgxe19OcubqV5w
April 1, 2024
51572
Middle income
MIC
false
2
1
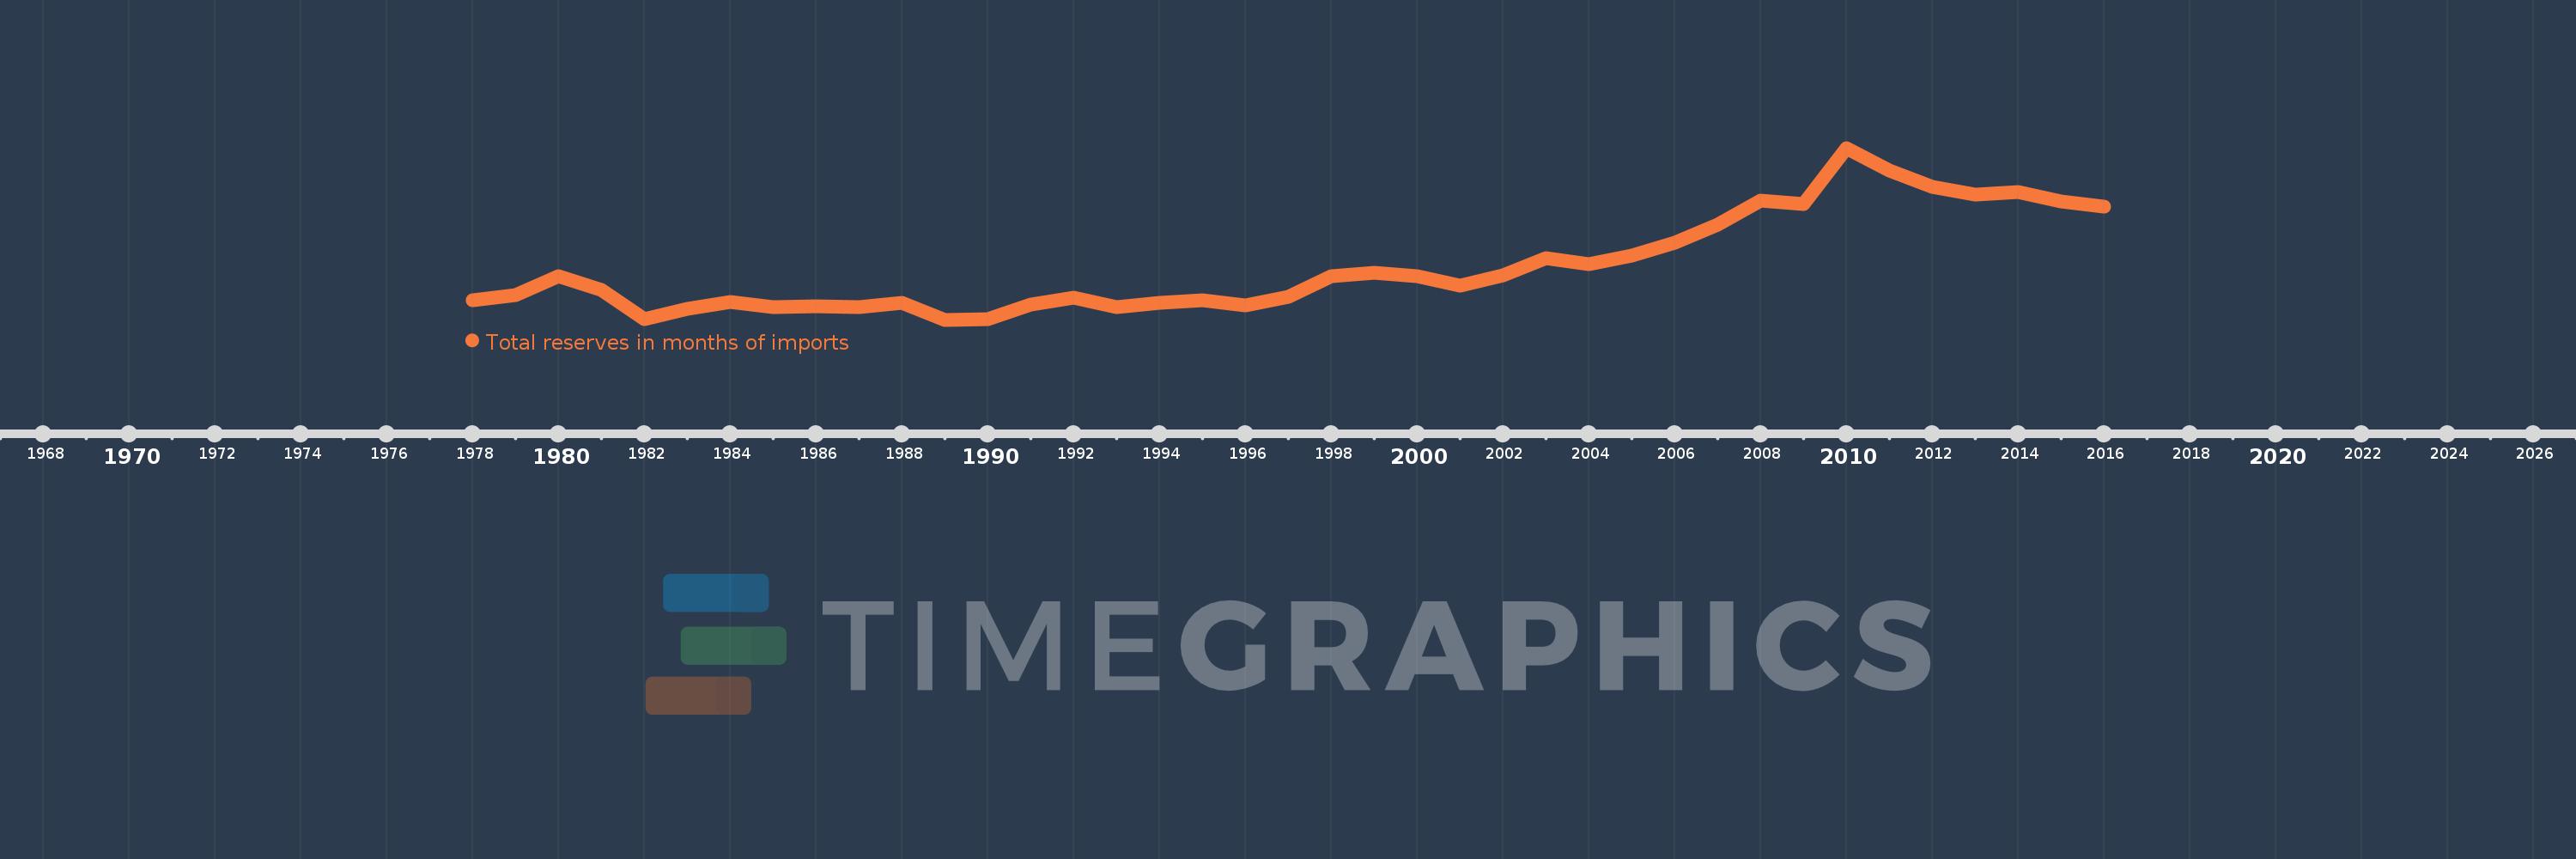
Total reserves in months of imports
2016,2015,2014,2013,2012,2011,2010,2009,2008,2007,2006,2005,2004,2003,2002,2001,2000,1999,1998,1997,1996,1995,1994,1993,1992,1991,1990,1989,1988,1987,1986,1985,1984,1983,1982,1981,1980,1979,1978
This statistics in other country:
AfghanistanAlbaniaAlgeriaAngolaAntigua and BarbudaArab WorldArgentinaArmeniaArubaAustraliaAustriaAzerbaijanBahamas, TheBahrainBangladeshBarbadosBelarusBelgiumBelizeBeninBhutanBoliviaBosnia and HerzegovinaBotswanaBrazilBrunei DarussalamBulgariaBurkina FasoBurundiCabo VerdeCambodiaCameroonCanadaCaribbean small statesCentral African RepublicCentral Europe and the BalticsChadChileChinaColombiaComorosCongo, Dem. Rep.Congo, Rep.Costa RicaCote d'IvoireCroatiaCuracaoCyprusCzech RepublicDenmarkDjiboutiDominicaDominican RepublicEarly-demographic dividendEast Asia & PacificEast Asia & Pacific (excluding high income)East Asia & Pacific (IDA & IBRD countries)EcuadorEgypt, Arab Rep.El SalvadorEquatorial GuineaEritreaEstoniaEthiopiaEuro areaEurope & Central AsiaEurope & Central Asia (excluding high income)Europe & Central Asia (IDA & IBRD countries)European UnionFijiFinlandFragile and conflict affected situationsFranceGabonGambia, TheGeorgiaGermanyGhanaGreeceGrenadaGuatemalaGuineaGuinea-BissauGuyanaHaitiHeavily indebted poor countries (HIPC)High incomeHondurasHong Kong SAR, ChinaHungaryIBRD onlyIcelandIDA & IBRD totalIDA blendIDA onlyIDA totalIndiaIndonesiaIran, Islamic Rep.IraqIrelandIsraelItalyJamaicaJapanJordanKazakhstanKenyaKorea, Rep.KosovoKuwaitKyrgyz RepublicLao PDRLate-demographic dividendLatin America & Caribbean Latin America & Caribbean (excluding high income)Latin America & the Caribbean (IDA & IBRD countries)LatviaLeast developed countries: UN classificationLebanonLesothoLiberiaLibyaLithuaniaLow & middle incomeLow incomeLower middle incomeLuxembourgMacao SAR, ChinaMacedonia, FYRMadagascarMalawiMalaysiaMaldivesMaliMaltaMauritaniaMauritiusMexicoMicronesia, Fed. Sts.Middle East & North AfricaMiddle East & North Africa (excluding high income)Middle East & North Africa (IDA & IBRD countries)Middle incomeMoldovaMongoliaMontenegroMoroccoMozambiqueMyanmarNamibiaNepalNetherlandsNicaraguaNigerNigeriaNorth AmericaNorwayOECD membersOmanOther small statesPacific island small statesPakistanPanamaPapua New GuineaParaguayPeruPhilippinesPolandPortugalPost-demographic dividendPre-demographic dividendQatarRomaniaRussian FederationRwandaSamoaSao Tome and PrincipeSaudi ArabiaSenegalSerbiaSeychellesSierra LeoneSingaporeSlovak RepublicSloveniaSmall statesSolomon IslandsSouth AfricaSouth AsiaSouth Asia (IDA & IBRD)South SudanSpainSri LankaSt. Kitts and NevisSt. LuciaSt. Vincent and the GrenadinesSub-Saharan Africa Sub-Saharan Africa (excluding high income)Sub-Saharan Africa (IDA & IBRD countries)SudanSurinameSwazilandSwedenSwitzerlandSyrian Arab RepublicTajikistanTanzaniaThailandTimor-LesteTogoTongaTrinidad and TobagoTunisiaTurkeyUgandaUkraineUnited KingdomUnited StatesUpper middle incomeUruguayVanuatuVenezuela, RBVietnamWest Bank and GazaWorldYemen, Rep.ZambiaZimbabwe Timeline:
This timeline shows a graph from 1978 to 2016 of Middle income. No data until 1977. Number of actual observations by date: 39.
Source name:
World Development Indicators
Source organization:
International Monetary Fund, International Financial Statistics and data files.
Categories, topics:
Financial Sector, External Debt
Last updated:
apr 23, 2017
Indicators value changes by year
Maximum:
19.368
jan 1, 2010
At the date of observation
Value
Absolute change
Change from previous value
jan 1, 1978
5.971
+5.971
0.0%
jan 1, 1979
6.405
+0.433
7.26%
jan 1, 1980
8.12
+1.715
26.78%
jan 1, 1981
6.856
-1.264
-15.57%
jan 1, 1982
4.315
-2.541
-37.07%
jan 1, 1983
5.245
+0.93
21.55%
jan 1, 1984
5.845
+0.6
11.45%
jan 1, 1985
5.41
-0.436
-7.45%
jan 1, 1986
5.447
+0.037
0.68%
jan 1, 1987
5.408
-0.038
-0.7%
jan 1, 1988
5.729
+0.321
5.93%
jan 1, 1989
4.263
-1.466
-25.59%
jan 1, 1990
4.338
+0.075
1.76%
jan 1, 1991
5.565
+1.227
28.29%
jan 1, 1992
6.167
+0.601
10.8%
jan 1, 1993
5.351
-0.816
-13.23%
jan 1, 1994
5.722
+0.371
6.92%
jan 1, 1995
5.983
+0.261
4.56%
jan 1, 1996
5.507
-0.476
-7.95%
jan 1, 1997
6.264
+0.757
13.74%
jan 1, 1998
8.081
+1.817
29.01%
jan 1, 1999
8.367
+0.286
3.54%
jan 1, 2000
8.119
-0.248
-2.97%
jan 1, 2001
7.241
-0.878
-10.82%
jan 1, 2002
8.174
+0.933
12.89%
jan 1, 2003
9.703
+1.529
18.71%
jan 1, 2004
9.164
-0.54
-5.56%
jan 1, 2005
9.915
+0.751
8.2%
jan 1, 2006
11.037
+1.122
11.31%
jan 1, 2007
12.589
+1.553
14.07%
jan 1, 2008
14.706
+2.117
16.82%
jan 1, 2009
14.421
-0.285
-1.94%
jan 1, 2010
19.368
+4.946
34.3%
jan 1, 2011
17.352
-2.015
-10.4%
jan 1, 2012
15.95
-1.402
-8.08%
jan 1, 2013
15.285
-0.665
-4.17%
jan 1, 2014
15.516
+0.231
1.51%
jan 1, 2015
14.629
-0.887
-5.72%
jan 1, 2016
14.216
-0.413
-2.83%
Ranking of countries by current statistics by years


Comments: