29
/
en
AIzaSyAYiBZKx7MnpbEhh9jyipgxe19OcubqV5w
April 1, 2024
40402
IDA total
IDA
false
2
1
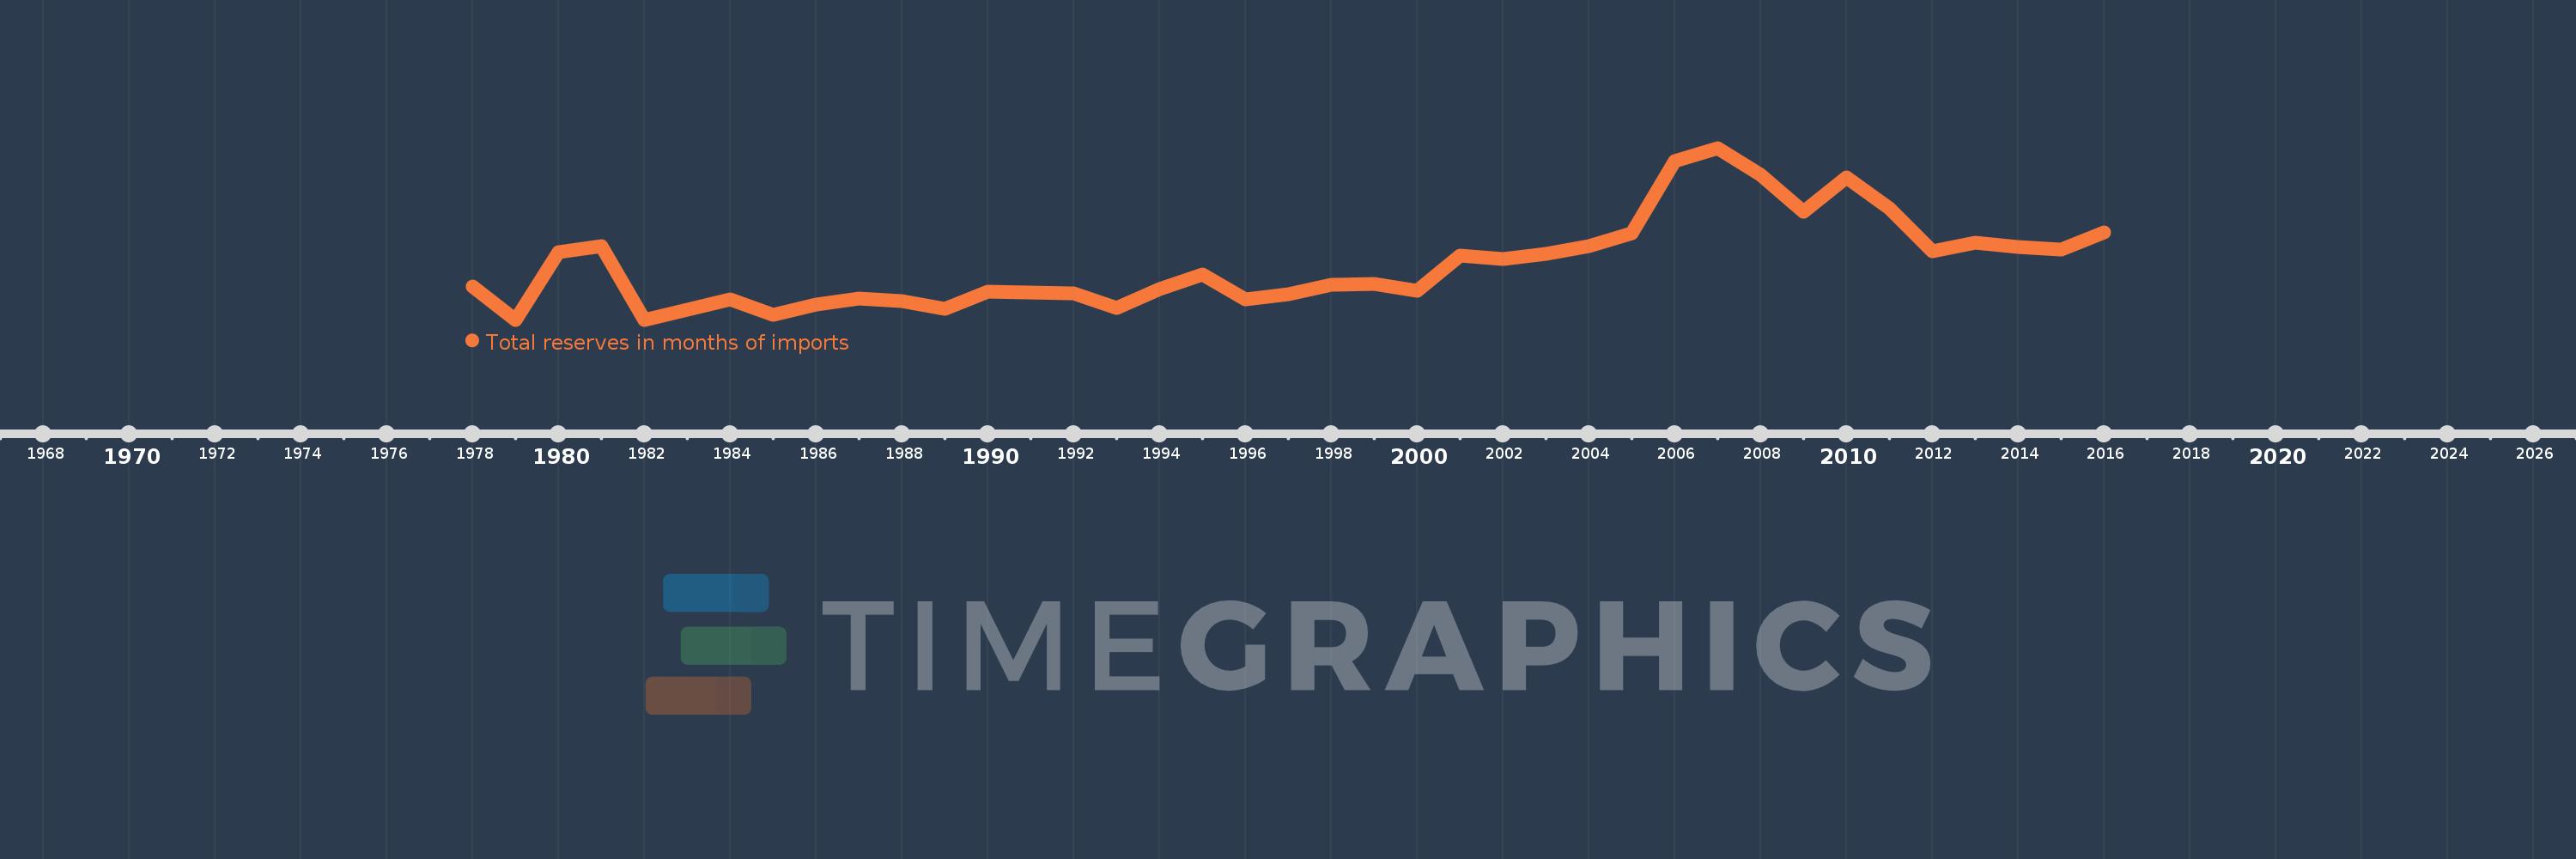
Total reserves in months of imports
2016,2015,2014,2013,2012,2011,2010,2009,2008,2007,2006,2005,2004,2003,2002,2001,2000,1999,1998,1997,1996,1995,1994,1993,1992,1991,1990,1989,1988,1987,1986,1985,1984,1983,1982,1981,1980,1979,1978
This statistics in other country:
AfghanistanAlbaniaAlgeriaAngolaAntigua and BarbudaArab WorldArgentinaArmeniaArubaAustraliaAustriaAzerbaijanBahamas, TheBahrainBangladeshBarbadosBelarusBelgiumBelizeBeninBhutanBoliviaBosnia and HerzegovinaBotswanaBrazilBrunei DarussalamBulgariaBurkina FasoBurundiCabo VerdeCambodiaCameroonCanadaCaribbean small statesCentral African RepublicCentral Europe and the BalticsChadChileChinaColombiaComorosCongo, Dem. Rep.Congo, Rep.Costa RicaCote d'IvoireCroatiaCuracaoCyprusCzech RepublicDenmarkDjiboutiDominicaDominican RepublicEarly-demographic dividendEast Asia & PacificEast Asia & Pacific (excluding high income)East Asia & Pacific (IDA & IBRD countries)EcuadorEgypt, Arab Rep.El SalvadorEquatorial GuineaEritreaEstoniaEthiopiaEuro areaEurope & Central AsiaEurope & Central Asia (excluding high income)Europe & Central Asia (IDA & IBRD countries)European UnionFijiFinlandFragile and conflict affected situationsFranceGabonGambia, TheGeorgiaGermanyGhanaGreeceGrenadaGuatemalaGuineaGuinea-BissauGuyanaHaitiHeavily indebted poor countries (HIPC)High incomeHondurasHong Kong SAR, ChinaHungaryIBRD onlyIcelandIDA & IBRD totalIDA blendIDA onlyIDA totalIndiaIndonesiaIran, Islamic Rep.IraqIrelandIsraelItalyJamaicaJapanJordanKazakhstanKenyaKorea, Rep.KosovoKuwaitKyrgyz RepublicLao PDRLate-demographic dividendLatin America & Caribbean Latin America & Caribbean (excluding high income)Latin America & the Caribbean (IDA & IBRD countries)LatviaLeast developed countries: UN classificationLebanonLesothoLiberiaLibyaLithuaniaLow & middle incomeLow incomeLower middle incomeLuxembourgMacao SAR, ChinaMacedonia, FYRMadagascarMalawiMalaysiaMaldivesMaliMaltaMauritaniaMauritiusMexicoMicronesia, Fed. Sts.Middle East & North AfricaMiddle East & North Africa (excluding high income)Middle East & North Africa (IDA & IBRD countries)Middle incomeMoldovaMongoliaMontenegroMoroccoMozambiqueMyanmarNamibiaNepalNetherlandsNicaraguaNigerNigeriaNorth AmericaNorwayOECD membersOmanOther small statesPacific island small statesPakistanPanamaPapua New GuineaParaguayPeruPhilippinesPolandPortugalPost-demographic dividendPre-demographic dividendQatarRomaniaRussian FederationRwandaSamoaSao Tome and PrincipeSaudi ArabiaSenegalSerbiaSeychellesSierra LeoneSingaporeSlovak RepublicSloveniaSmall statesSolomon IslandsSouth AfricaSouth AsiaSouth Asia (IDA & IBRD)South SudanSpainSri LankaSt. Kitts and NevisSt. LuciaSt. Vincent and the GrenadinesSub-Saharan Africa Sub-Saharan Africa (excluding high income)Sub-Saharan Africa (IDA & IBRD countries)SudanSurinameSwazilandSwedenSwitzerlandSyrian Arab RepublicTajikistanTanzaniaThailandTimor-LesteTogoTongaTrinidad and TobagoTunisiaTurkeyUgandaUkraineUnited KingdomUnited StatesUpper middle incomeUruguayVanuatuVenezuela, RBVietnamWest Bank and GazaWorldYemen, Rep.ZambiaZimbabwe Timeline:
This timeline shows a graph from 1978 to 2016 of IDA total. No data until 1977. Number of actual observations by date: 39.
Source name:
World Development Indicators
Source organization:
International Monetary Fund, International Financial Statistics and data files.
Categories, topics:
Financial Sector, External Debt
Last updated:
apr 23, 2017
Indicators value changes by year
At the date of observation
Value
Absolute change
Change from previous value
jan 1, 1978
3.67
+3.67
0.0%
jan 1, 1979
2.637
-1.033
-28.15%
jan 1, 1980
4.765
+2.128
80.73%
jan 1, 1981
4.955
+0.19
3.99%
jan 1, 1982
2.639
-2.316
-46.74%
jan 1, 1983
2.966
+0.326
12.36%
jan 1, 1984
3.287
+0.322
10.85%
jan 1, 1985
2.783
-0.505
-15.35%
jan 1, 1986
3.117
+0.334
12.01%
jan 1, 1987
3.308
+0.191
6.14%
jan 1, 1988
3.237
-0.071
-2.14%
jan 1, 1989
2.986
-0.251
-7.75%
jan 1, 1990
3.522
+0.536
17.93%
jan 1, 1991
3.506
-0.016
-0.45%
jan 1, 1992
3.475
-0.031
-0.88%
jan 1, 1993
3.018
-0.458
-13.17%
jan 1, 1994
3.597
+0.58
19.21%
jan 1, 1995
4.051
+0.454
12.61%
jan 1, 1996
3.273
-0.778
-19.2%
jan 1, 1997
3.444
+0.171
5.21%
jan 1, 1998
3.746
+0.302
8.76%
jan 1, 1999
3.754
+0.008
0.21%
jan 1, 2000
3.555
-0.198
-5.28%
jan 1, 2001
4.659
+1.104
31.04%
jan 1, 2002
4.559
-0.1
-2.14%
jan 1, 2003
4.723
+0.164
3.59%
jan 1, 2004
4.941
+0.218
4.61%
jan 1, 2005
5.351
+0.41
8.31%
jan 1, 2006
7.633
+2.282
42.64%
jan 1, 2007
8.043
+0.409
5.36%
jan 1, 2008
7.193
-0.85
-10.56%
jan 1, 2009
6.026
-1.168
-16.23%
jan 1, 2010
7.103
+1.077
17.88%
jan 1, 2011
6.144
-0.959
-13.5%
jan 1, 2012
4.784
-1.36
-22.13%
jan 1, 2013
5.054
+0.269
5.63%
jan 1, 2014
4.919
-0.135
-2.67%
jan 1, 2015
4.846
-0.073
-1.48%
jan 1, 2016
5.382
+0.536
11.05%
Ranking of countries by current statistics by years


Comments: