29
/
en
AIzaSyAYiBZKx7MnpbEhh9jyipgxe19OcubqV5w
April 1, 2024
170583
Korea, Rep.
KOR
true
2
1
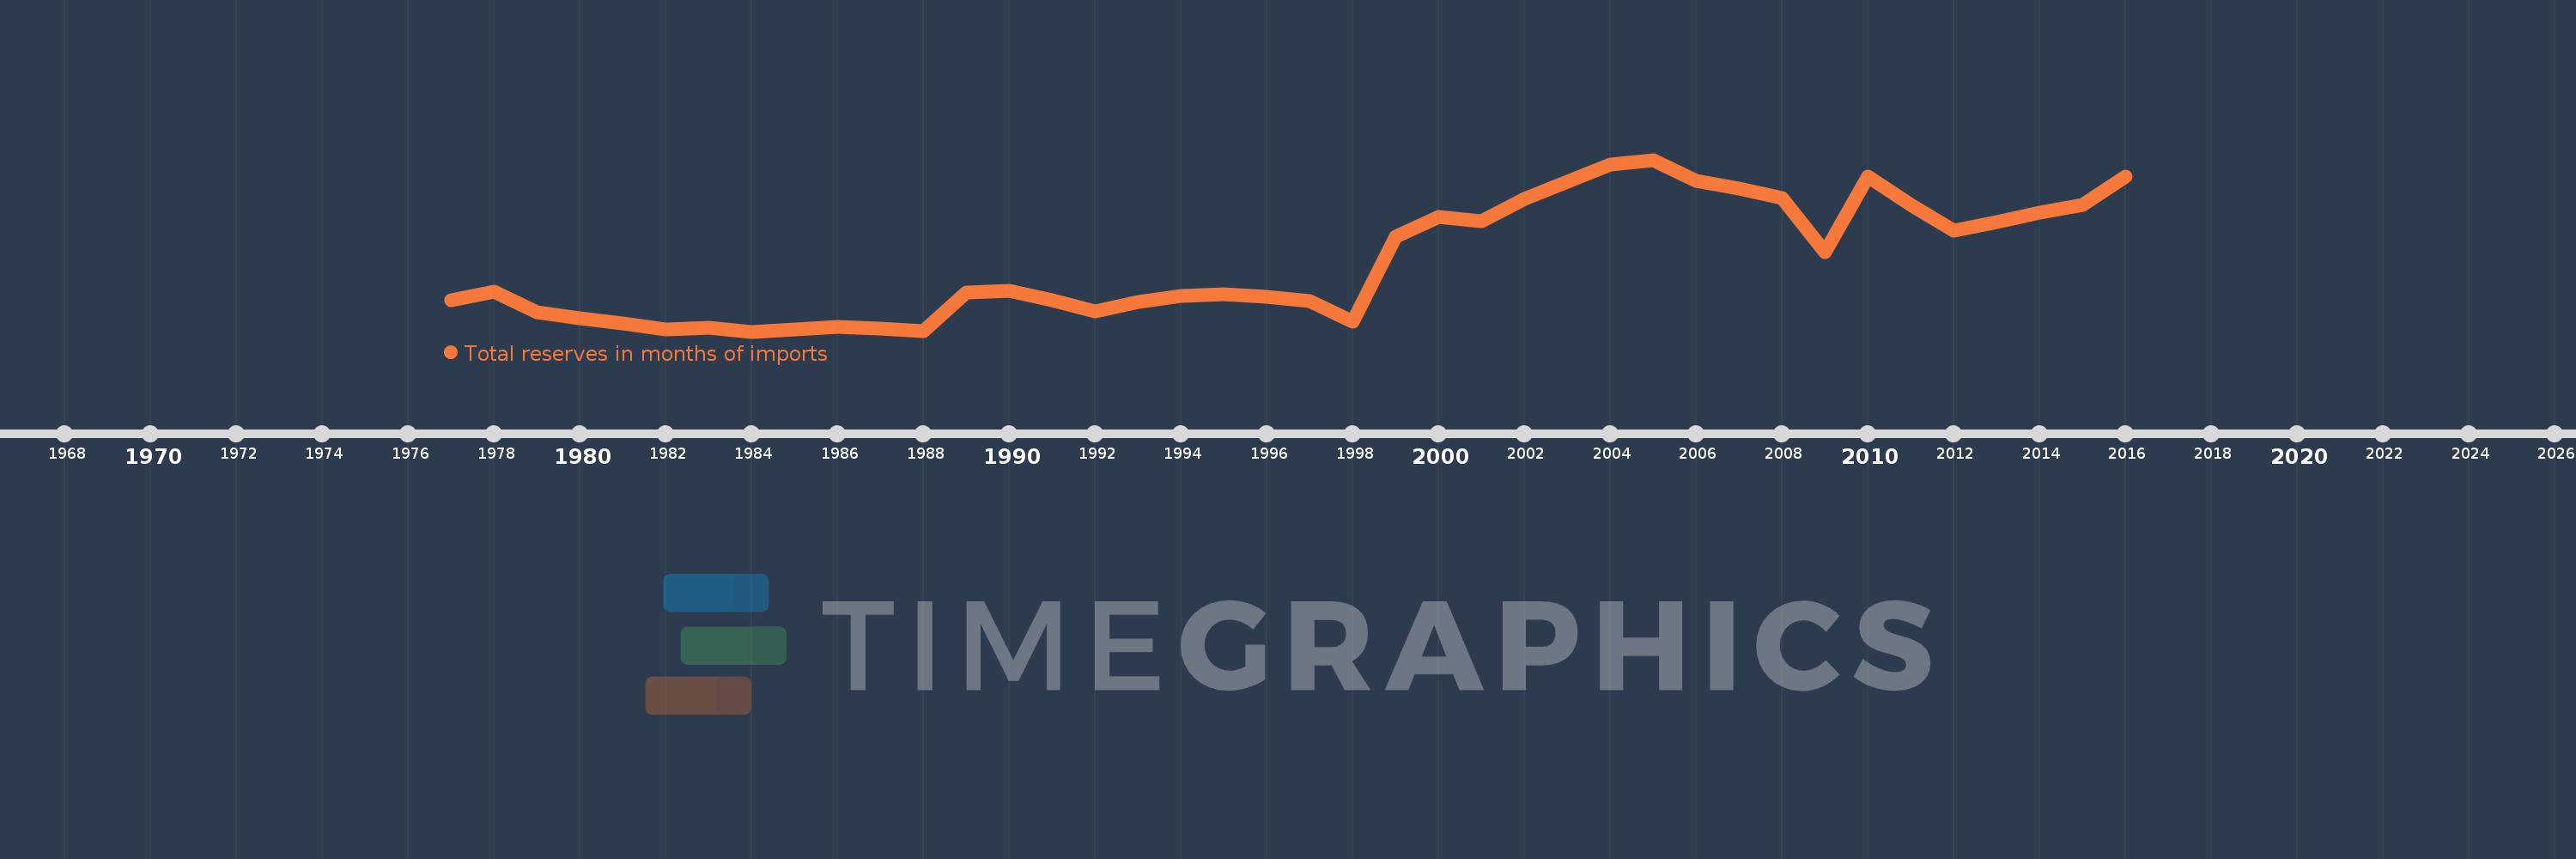
Total reserves in months of imports
2016,2015,2014,2013,2012,2011,2010,2009,2008,2007,2006,2005,2004,2003,2002,2001,2000,1999,1998,1997,1996,1995,1994,1993,1992,1991,1990,1989,1988,1987,1986,1985,1984,1983,1982,1981,1980,1979,1978,1977
This statistics in other country:
AfghanistanAlbaniaAlgeriaAngolaAntigua and BarbudaArab WorldArgentinaArmeniaArubaAustraliaAustriaAzerbaijanBahamas, TheBahrainBangladeshBarbadosBelarusBelgiumBelizeBeninBhutanBoliviaBosnia and HerzegovinaBotswanaBrazilBrunei DarussalamBulgariaBurkina FasoBurundiCabo VerdeCambodiaCameroonCanadaCaribbean small statesCentral African RepublicCentral Europe and the BalticsChadChileChinaColombiaComorosCongo, Dem. Rep.Congo, Rep.Costa RicaCote d'IvoireCroatiaCuracaoCyprusCzech RepublicDenmarkDjiboutiDominicaDominican RepublicEarly-demographic dividendEast Asia & PacificEast Asia & Pacific (excluding high income)East Asia & Pacific (IDA & IBRD countries)EcuadorEgypt, Arab Rep.El SalvadorEquatorial GuineaEritreaEstoniaEthiopiaEuro areaEurope & Central AsiaEurope & Central Asia (excluding high income)Europe & Central Asia (IDA & IBRD countries)European UnionFijiFinlandFragile and conflict affected situationsFranceGabonGambia, TheGeorgiaGermanyGhanaGreeceGrenadaGuatemalaGuineaGuinea-BissauGuyanaHaitiHeavily indebted poor countries (HIPC)High incomeHondurasHong Kong SAR, ChinaHungaryIBRD onlyIcelandIDA & IBRD totalIDA blendIDA onlyIDA totalIndiaIndonesiaIran, Islamic Rep.IraqIrelandIsraelItalyJamaicaJapanJordanKazakhstanKenyaKorea, Rep.KosovoKuwaitKyrgyz RepublicLao PDRLate-demographic dividendLatin America & Caribbean Latin America & Caribbean (excluding high income)Latin America & the Caribbean (IDA & IBRD countries)LatviaLeast developed countries: UN classificationLebanonLesothoLiberiaLibyaLithuaniaLow & middle incomeLow incomeLower middle incomeLuxembourgMacao SAR, ChinaMacedonia, FYRMadagascarMalawiMalaysiaMaldivesMaliMaltaMauritaniaMauritiusMexicoMicronesia, Fed. Sts.Middle East & North AfricaMiddle East & North Africa (excluding high income)Middle East & North Africa (IDA & IBRD countries)Middle incomeMoldovaMongoliaMontenegroMoroccoMozambiqueMyanmarNamibiaNepalNetherlandsNicaraguaNigerNigeriaNorth AmericaNorwayOECD membersOmanOther small statesPacific island small statesPakistanPanamaPapua New GuineaParaguayPeruPhilippinesPolandPortugalPost-demographic dividendPre-demographic dividendQatarRomaniaRussian FederationRwandaSamoaSao Tome and PrincipeSaudi ArabiaSenegalSerbiaSeychellesSierra LeoneSingaporeSlovak RepublicSloveniaSmall statesSolomon IslandsSouth AfricaSouth AsiaSouth Asia (IDA & IBRD)South SudanSpainSri LankaSt. Kitts and NevisSt. LuciaSt. Vincent and the GrenadinesSub-Saharan Africa Sub-Saharan Africa (excluding high income)Sub-Saharan Africa (IDA & IBRD countries)SudanSurinameSwazilandSwedenSwitzerlandSyrian Arab RepublicTajikistanTanzaniaThailandTimor-LesteTogoTongaTrinidad and TobagoTunisiaTurkeyUgandaUkraineUnited KingdomUnited StatesUpper middle incomeUruguayVanuatuVenezuela, RBVietnamWest Bank and GazaWorldYemen, Rep.ZambiaZimbabwe Timeline:
This timeline shows a graph from 1977 to 2016 of Korea, Rep.. No data until 1976. Number of actual observations by date: 40.
Source name:
World Development Indicators
Source organization:
International Monetary Fund, International Financial Statistics and data files.
Categories, topics:
Financial Sector, External Debt
Last updated:
apr 23, 2017
Indicators value changes by year
At the date of observation
Value
Absolute change
Change from previous value
jan 1, 1977
2.356
+2.356
0.0%
jan 1, 1978
2.702
+0.347
14.72%
jan 1, 1979
1.812
-0.89
-32.95%
jan 1, 1980
1.547
-0.264
-14.59%
jan 1, 1981
1.328
-0.219
-14.18%
jan 1, 1982
1.05
-0.278
-20.97%
jan 1, 1983
1.143
+0.093
8.89%
jan 1, 1984
0.956
-0.187
-16.36%
jan 1, 1985
1.044
+0.088
9.22%
jan 1, 1986
1.159
+0.115
11.05%
jan 1, 1987
1.105
-0.054
-4.65%
jan 1, 1988
0.968
-0.137
-12.39%
jan 1, 1989
2.664
+1.696
175.09%
jan 1, 1990
2.754
+0.089
3.36%
jan 1, 1991
2.333
-0.42
-15.26%
jan 1, 1992
1.848
-0.486
-20.81%
jan 1, 1993
2.266
+0.418
22.64%
jan 1, 1994
2.542
+0.276
12.19%
jan 1, 1995
2.623
+0.081
3.18%
jan 1, 1996
2.498
-0.125
-4.76%
jan 1, 1997
2.318
-0.18
-7.22%
jan 1, 1998
1.403
-0.915
-39.48%
jan 1, 1999
5.141
+3.738
266.51%
jan 1, 2000
6.011
+0.87
16.93%
jan 1, 2001
5.817
-0.194
-3.22%
jan 1, 2002
6.833
+1.016
17.46%
jan 1, 2003
7.567
+0.735
10.75%
jan 1, 2004
8.343
+0.775
10.25%
jan 1, 2005
8.544
+0.201
2.41%
jan 1, 2006
7.609
-0.935
-10.95%
jan 1, 2007
7.287
-0.321
-4.22%
jan 1, 2008
6.861
-0.427
-5.85%
jan 1, 2009
4.467
-2.394
-34.89%
jan 1, 2010
7.797
+3.33
74.55%
jan 1, 2011
6.545
-1.251
-16.05%
jan 1, 2012
5.4
-1.145
-17.5%
jan 1, 2013
5.776
+0.376
6.96%
jan 1, 2014
6.222
+0.447
7.73%
jan 1, 2015
6.571
+0.349
5.6%
jan 1, 2016
7.799
+1.228
18.68%
Ranking of countries by current statistics by years


Comments: