29
/
en
AIzaSyAYiBZKx7MnpbEhh9jyipgxe19OcubqV5w
April 1, 2024
30359
Euro area
EMU
false
2
1
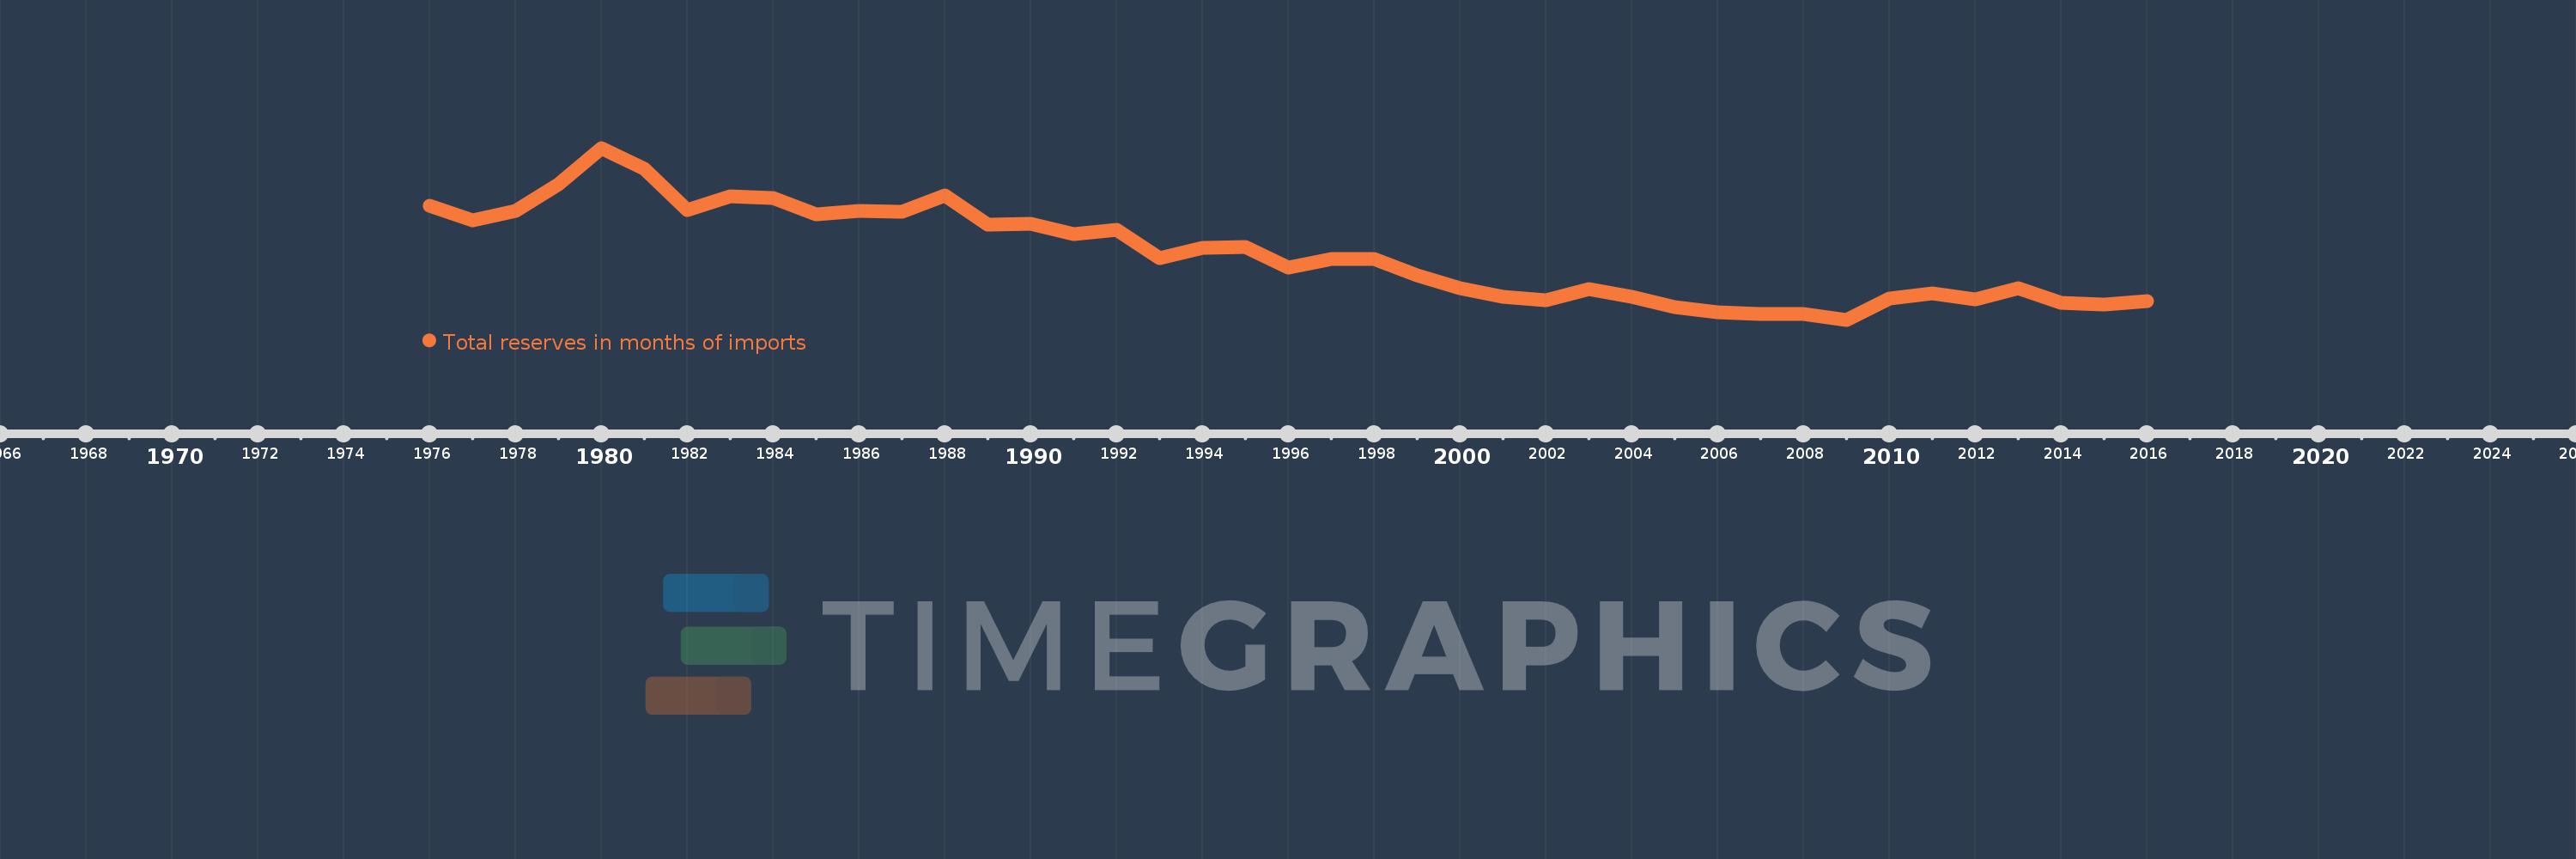
Total reserves in months of imports
2016,2015,2014,2013,2012,2011,2010,2009,2008,2007,2006,2005,2004,2003,2002,2001,2000,1999,1998,1997,1996,1995,1994,1993,1992,1991,1990,1989,1988,1987,1986,1985,1984,1983,1982,1981,1980,1979,1978,1977,1976
This statistics in other country:
AfghanistanAlbaniaAlgeriaAngolaAntigua and BarbudaArab WorldArgentinaArmeniaArubaAustraliaAustriaAzerbaijanBahamas, TheBahrainBangladeshBarbadosBelarusBelgiumBelizeBeninBhutanBoliviaBosnia and HerzegovinaBotswanaBrazilBrunei DarussalamBulgariaBurkina FasoBurundiCabo VerdeCambodiaCameroonCanadaCaribbean small statesCentral African RepublicCentral Europe and the BalticsChadChileChinaColombiaComorosCongo, Dem. Rep.Congo, Rep.Costa RicaCote d'IvoireCroatiaCuracaoCyprusCzech RepublicDenmarkDjiboutiDominicaDominican RepublicEarly-demographic dividendEast Asia & PacificEast Asia & Pacific (excluding high income)East Asia & Pacific (IDA & IBRD countries)EcuadorEgypt, Arab Rep.El SalvadorEquatorial GuineaEritreaEstoniaEthiopiaEuro areaEurope & Central AsiaEurope & Central Asia (excluding high income)Europe & Central Asia (IDA & IBRD countries)European UnionFijiFinlandFragile and conflict affected situationsFranceGabonGambia, TheGeorgiaGermanyGhanaGreeceGrenadaGuatemalaGuineaGuinea-BissauGuyanaHaitiHeavily indebted poor countries (HIPC)High incomeHondurasHong Kong SAR, ChinaHungaryIBRD onlyIcelandIDA & IBRD totalIDA blendIDA onlyIDA totalIndiaIndonesiaIran, Islamic Rep.IraqIrelandIsraelItalyJamaicaJapanJordanKazakhstanKenyaKorea, Rep.KosovoKuwaitKyrgyz RepublicLao PDRLate-demographic dividendLatin America & Caribbean Latin America & Caribbean (excluding high income)Latin America & the Caribbean (IDA & IBRD countries)LatviaLeast developed countries: UN classificationLebanonLesothoLiberiaLibyaLithuaniaLow & middle incomeLow incomeLower middle incomeLuxembourgMacao SAR, ChinaMacedonia, FYRMadagascarMalawiMalaysiaMaldivesMaliMaltaMauritaniaMauritiusMexicoMicronesia, Fed. Sts.Middle East & North AfricaMiddle East & North Africa (excluding high income)Middle East & North Africa (IDA & IBRD countries)Middle incomeMoldovaMongoliaMontenegroMoroccoMozambiqueMyanmarNamibiaNepalNetherlandsNicaraguaNigerNigeriaNorth AmericaNorwayOECD membersOmanOther small statesPacific island small statesPakistanPanamaPapua New GuineaParaguayPeruPhilippinesPolandPortugalPost-demographic dividendPre-demographic dividendQatarRomaniaRussian FederationRwandaSamoaSao Tome and PrincipeSaudi ArabiaSenegalSerbiaSeychellesSierra LeoneSingaporeSlovak RepublicSloveniaSmall statesSolomon IslandsSouth AfricaSouth AsiaSouth Asia (IDA & IBRD)South SudanSpainSri LankaSt. Kitts and NevisSt. LuciaSt. Vincent and the GrenadinesSub-Saharan Africa Sub-Saharan Africa (excluding high income)Sub-Saharan Africa (IDA & IBRD countries)SudanSurinameSwazilandSwedenSwitzerlandSyrian Arab RepublicTajikistanTanzaniaThailandTimor-LesteTogoTongaTrinidad and TobagoTunisiaTurkeyUgandaUkraineUnited KingdomUnited StatesUpper middle incomeUruguayVanuatuVenezuela, RBVietnamWest Bank and GazaWorldYemen, Rep.ZambiaZimbabwe Timeline:
This timeline shows a graph from 1976 to 2016 of Euro area. No data until 1975. Number of actual observations by date: 41.
Source name:
World Development Indicators
Source organization:
International Monetary Fund, International Financial Statistics and data files.
Categories, topics:
Financial Sector, External Debt
Last updated:
apr 23, 2017
Indicators value changes by year
At the date of observation
Value
Absolute change
Change from previous value
jan 1, 1976
4.734
+4.734
0.0%
jan 1, 1977
4.257
-0.477
-10.08%
jan 1, 1978
4.559
+0.303
7.11%
jan 1, 1979
5.409
+0.85
18.65%
jan 1, 1980
6.535
+1.126
20.82%
jan 1, 1981
5.89
-0.645
-9.87%
jan 1, 1982
4.591
-1.3
-22.07%
jan 1, 1983
5.021
+0.43
9.37%
jan 1, 1984
4.953
-0.068
-1.35%
jan 1, 1985
4.466
-0.486
-9.82%
jan 1, 1986
4.569
+0.103
2.29%
jan 1, 1987
4.539
-0.03
-0.65%
jan 1, 1988
5.038
+0.499
11.0%
jan 1, 1989
4.12
-0.918
-18.23%
jan 1, 1990
4.162
+0.042
1.03%
jan 1, 1991
3.838
-0.324
-7.78%
jan 1, 1992
3.973
+0.134
3.5%
jan 1, 1993
3.073
-0.9
-22.65%
jan 1, 1994
3.395
+0.322
10.49%
jan 1, 1995
3.425
+0.03
0.87%
jan 1, 1996
2.789
-0.636
-18.56%
jan 1, 1997
3.054
+0.265
9.52%
jan 1, 1998
3.042
-0.012
-0.41%
jan 1, 1999
2.536
-0.506
-16.64%
jan 1, 2000
2.152
-0.383
-15.11%
jan 1, 2001
1.877
-0.276
-12.81%
jan 1, 2002
1.776
-0.101
-5.38%
jan 1, 2003
2.107
+0.331
18.63%
jan 1, 2004
1.88
-0.227
-10.76%
jan 1, 2005
1.558
-0.322
-17.12%
jan 1, 2006
1.377
-0.181
-11.62%
jan 1, 2007
1.343
-0.034
-2.49%
jan 1, 2008
1.334
-0.008
-0.63%
jan 1, 2009
1.152
-0.182
-13.65%
jan 1, 2010
1.817
+0.665
57.71%
jan 1, 2011
1.979
+0.162
8.93%
jan 1, 2012
1.801
-0.179
-9.02%
jan 1, 2013
2.129
+0.328
18.23%
jan 1, 2014
1.691
-0.438
-20.59%
jan 1, 2015
1.619
-0.072
-4.23%
jan 1, 2016
1.742
+0.123
7.6%
Ranking of countries by current statistics by years


Comments: