29
/
en
AIzaSyAYiBZKx7MnpbEhh9jyipgxe19OcubqV5w
April 1, 2024
148680
Guyana
GUY
true
2
1
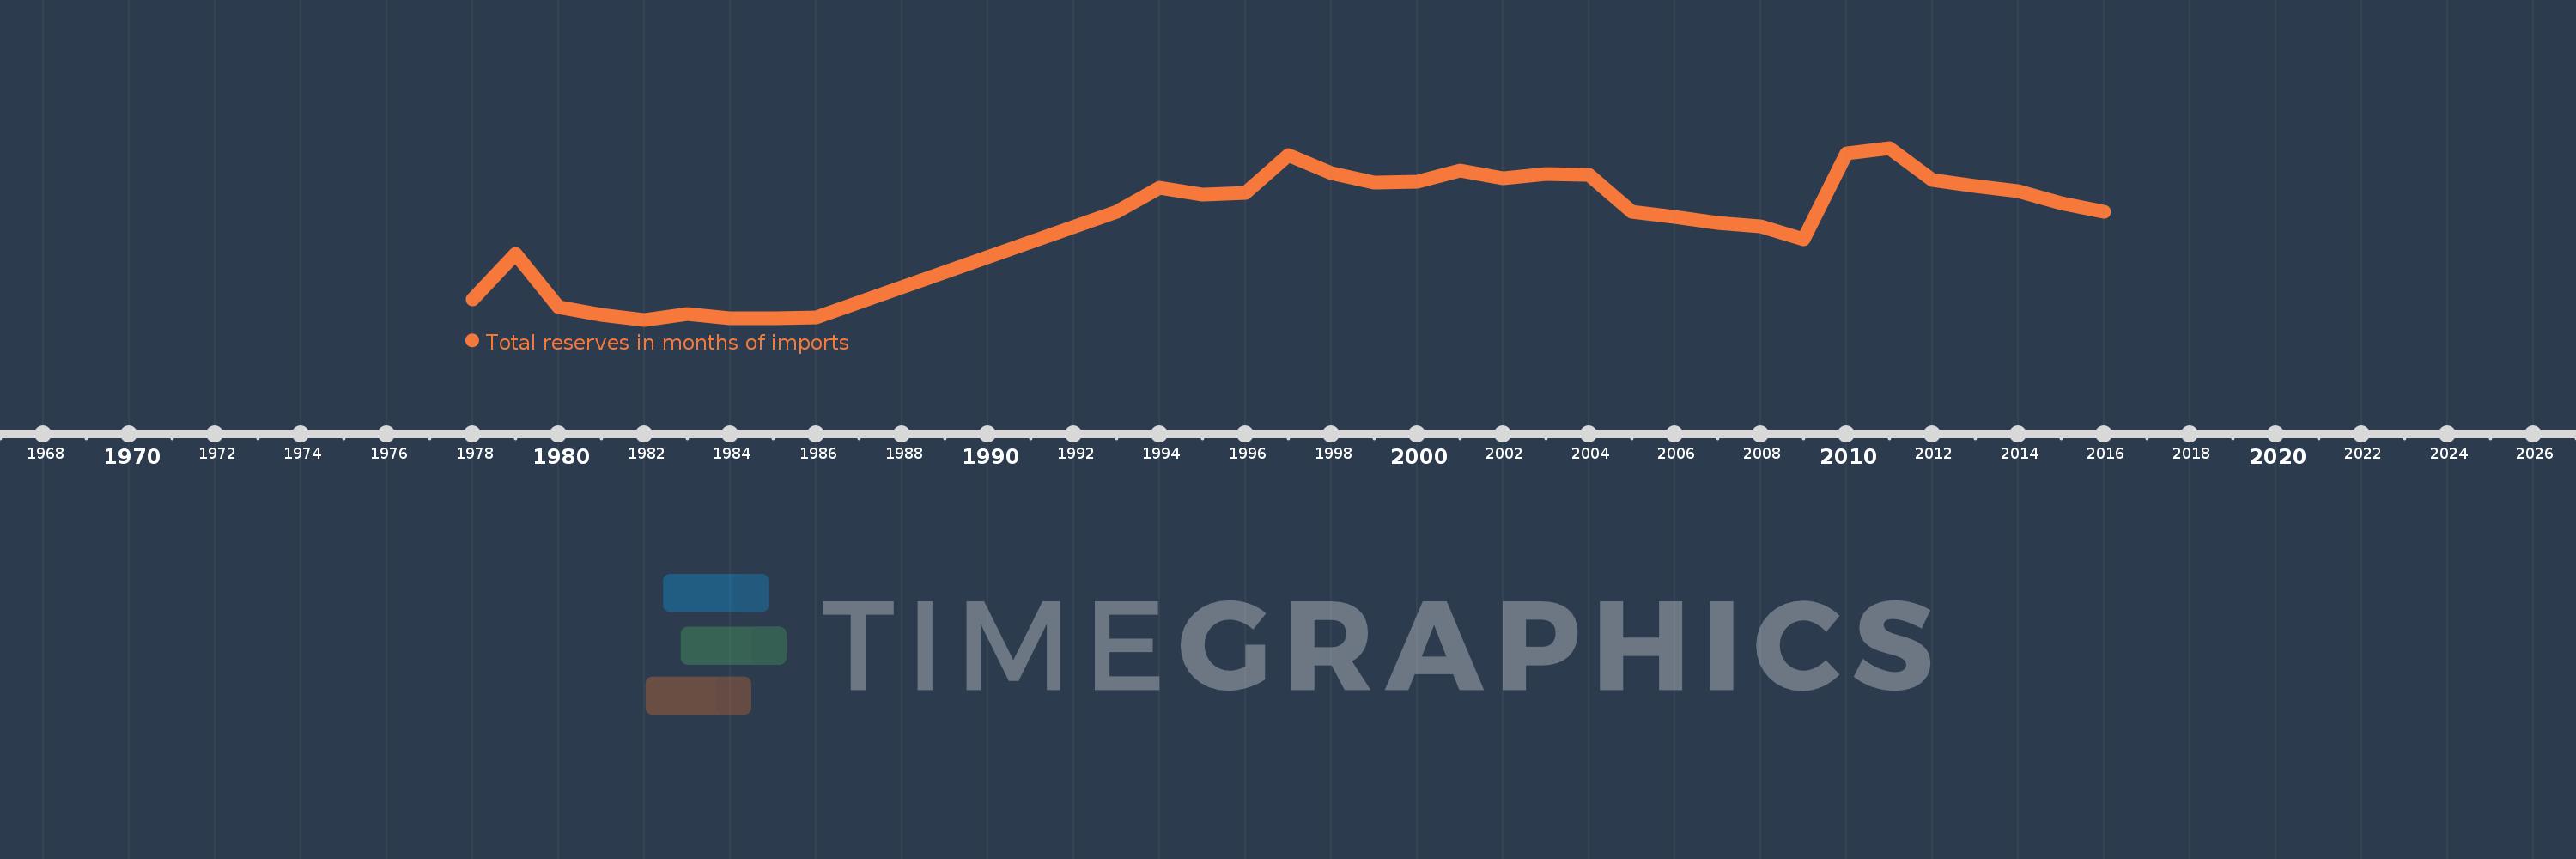
Total reserves in months of imports
2016,2015,2014,2013,2012,2011,2010,2009,2008,2007,2006,2005,2004,2003,2002,2001,2000,1999,1998,1997,1996,1995,1994,1993,1986,1985,1984,1983,1982,1981,1980,1979,1978
This statistics in other country:
AfghanistanAlbaniaAlgeriaAngolaAntigua and BarbudaArab WorldArgentinaArmeniaArubaAustraliaAustriaAzerbaijanBahamas, TheBahrainBangladeshBarbadosBelarusBelgiumBelizeBeninBhutanBoliviaBosnia and HerzegovinaBotswanaBrazilBrunei DarussalamBulgariaBurkina FasoBurundiCabo VerdeCambodiaCameroonCanadaCaribbean small statesCentral African RepublicCentral Europe and the BalticsChadChileChinaColombiaComorosCongo, Dem. Rep.Congo, Rep.Costa RicaCote d'IvoireCroatiaCuracaoCyprusCzech RepublicDenmarkDjiboutiDominicaDominican RepublicEarly-demographic dividendEast Asia & PacificEast Asia & Pacific (excluding high income)East Asia & Pacific (IDA & IBRD countries)EcuadorEgypt, Arab Rep.El SalvadorEquatorial GuineaEritreaEstoniaEthiopiaEuro areaEurope & Central AsiaEurope & Central Asia (excluding high income)Europe & Central Asia (IDA & IBRD countries)European UnionFijiFinlandFragile and conflict affected situationsFranceGabonGambia, TheGeorgiaGermanyGhanaGreeceGrenadaGuatemalaGuineaGuinea-BissauGuyanaHaitiHeavily indebted poor countries (HIPC)High incomeHondurasHong Kong SAR, ChinaHungaryIBRD onlyIcelandIDA & IBRD totalIDA blendIDA onlyIDA totalIndiaIndonesiaIran, Islamic Rep.IraqIrelandIsraelItalyJamaicaJapanJordanKazakhstanKenyaKorea, Rep.KosovoKuwaitKyrgyz RepublicLao PDRLate-demographic dividendLatin America & Caribbean Latin America & Caribbean (excluding high income)Latin America & the Caribbean (IDA & IBRD countries)LatviaLeast developed countries: UN classificationLebanonLesothoLiberiaLibyaLithuaniaLow & middle incomeLow incomeLower middle incomeLuxembourgMacao SAR, ChinaMacedonia, FYRMadagascarMalawiMalaysiaMaldivesMaliMaltaMauritaniaMauritiusMexicoMicronesia, Fed. Sts.Middle East & North AfricaMiddle East & North Africa (excluding high income)Middle East & North Africa (IDA & IBRD countries)Middle incomeMoldovaMongoliaMontenegroMoroccoMozambiqueMyanmarNamibiaNepalNetherlandsNicaraguaNigerNigeriaNorth AmericaNorwayOECD membersOmanOther small statesPacific island small statesPakistanPanamaPapua New GuineaParaguayPeruPhilippinesPolandPortugalPost-demographic dividendPre-demographic dividendQatarRomaniaRussian FederationRwandaSamoaSao Tome and PrincipeSaudi ArabiaSenegalSerbiaSeychellesSierra LeoneSingaporeSlovak RepublicSloveniaSmall statesSolomon IslandsSouth AfricaSouth AsiaSouth Asia (IDA & IBRD)South SudanSpainSri LankaSt. Kitts and NevisSt. LuciaSt. Vincent and the GrenadinesSub-Saharan Africa Sub-Saharan Africa (excluding high income)Sub-Saharan Africa (IDA & IBRD countries)SudanSurinameSwazilandSwedenSwitzerlandSyrian Arab RepublicTajikistanTanzaniaThailandTimor-LesteTogoTongaTrinidad and TobagoTunisiaTurkeyUgandaUkraineUnited KingdomUnited StatesUpper middle incomeUruguayVanuatuVenezuela, RBVietnamWest Bank and GazaWorldYemen, Rep.ZambiaZimbabwe Timeline:
This timeline shows a graph from 1978 to 2016 of Guyana. No data until 1977. Number of actual observations by date: 33.
Source name:
World Development Indicators
Source organization:
International Monetary Fund, International Financial Statistics and data files.
Categories, topics:
Financial Sector, External Debt
Last updated:
apr 23, 2017
Indicators value changes by year
At the date of observation
Value
Absolute change
Change from previous value
jan 1, 1978
0.747
+0.747
0.0%
jan 1, 1979
2.076
+1.329
177.86%
jan 1, 1980
0.528
-1.547
-74.55%
jan 1, 1981
0.283
-0.245
-46.39%
jan 1, 1982
0.149
-0.134
-47.34%
jan 1, 1983
0.318
+0.169
113.51%
jan 1, 1984
0.204
-0.114
-35.91%
jan 1, 1985
0.203
-0.001
-0.46%
jan 1, 1986
0.22
+0.017
8.16%
jan 1, 1993
3.299
+3.08
1.4K%
jan 1, 1994
4.02
+0.72
21.83%
jan 1, 1995
3.803
-0.216
-5.38%
jan 1, 1996
3.85
+0.047
1.23%
jan 1, 1997
4.959
+1.109
28.81%
jan 1, 1998
4.432
-0.528
-10.64%
jan 1, 1999
4.157
-0.274
-6.19%
jan 1, 2000
4.186
+0.029
0.7%
jan 1, 2001
4.501
+0.314
7.51%
jan 1, 2002
4.296
-0.205
-4.55%
jan 1, 2003
4.419
+0.123
2.86%
jan 1, 2004
4.38
-0.039
-0.89%
jan 1, 2005
3.301
-1.078
-24.62%
jan 1, 2006
3.148
-0.154
-4.65%
jan 1, 2007
2.978
-0.17
-5.4%
jan 1, 2008
2.882
-0.095
-3.2%
jan 1, 2009
2.505
-0.377
-13.09%
jan 1, 2010
5.023
+2.518
100.5%
jan 1, 2011
5.173
+0.15
2.99%
jan 1, 2012
4.247
-0.926
-17.9%
jan 1, 2013
4.066
-0.181
-4.26%
jan 1, 2014
3.914
-0.153
-3.75%
jan 1, 2015
3.569
-0.345
-8.81%
jan 1, 2016
3.306
-0.263
-7.37%
Ranking of countries by current statistics by years


Comments: